R prop.table() Function

R prop.table() Function

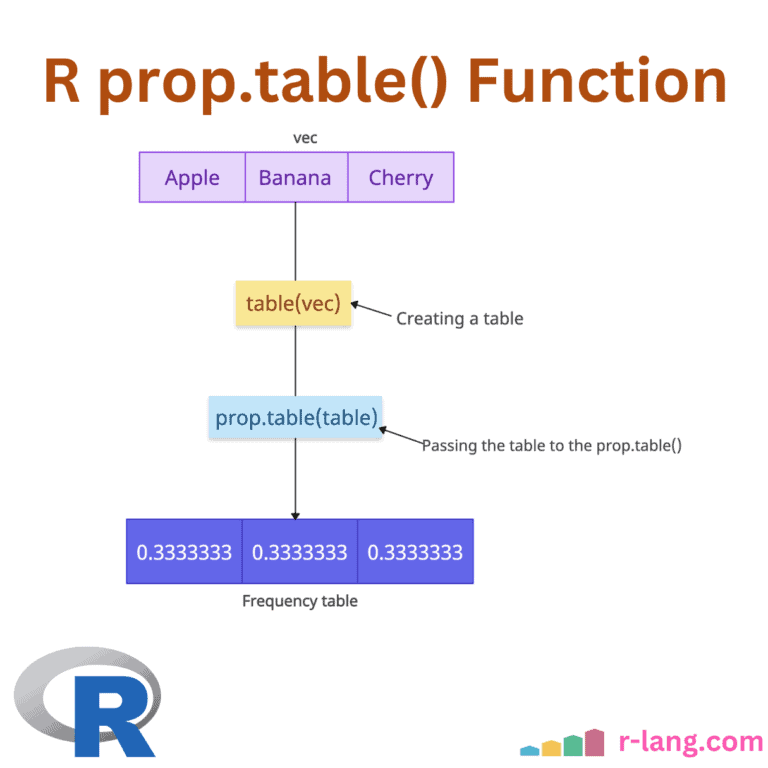
The prop.table() function in R calculates the proportion or relative frequency of values in a contingency table. It calculates the value of each cell in a table as a proportion of all values. For example, let’s say you have a table with a total of 5 elements like this: table(c(“A”, “B”, “C”, “D”, “E”)). Each value … Read more

R View() Function

R View() Function

The View() is a utility function in R that invokes a more intuitive spreadsheet-style data viewer on a matrix-like R object. View() does not print output in the console or return a value — it is a side-effect function that launches a separate data viewer window. It is ideal for quickly checking data contents, identifying patterns, or … Read more

summary() Function: Producing Summary Statistics in R

R summary() Function

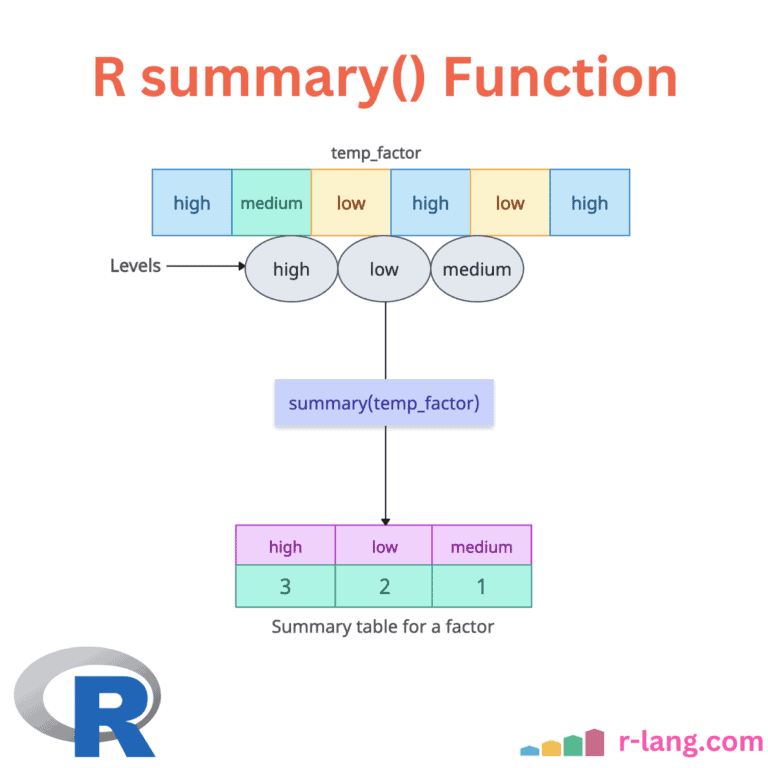
The summary() is a generic function that produces the summary statistics for various R objects, including vectors, matrices, data frames, and model objects. The above figure explains the summary for a data frame with three columns. For different types of objects, the summary() function produces different types of summaries: If the input is numeric, it … Read more

How to Calculate Standard Error in R

How to Calculate Standard Error in R

Standard Error (SE) measures the variability or dispersion of the sample mean estimate of a population mean. Here are three ways to calculate standard error in R: Using sd() with length() Using the standard error formula Using std.error() from plotrix package Here is the basic formula: where: σ = sample standard deviation n = sample … Read more