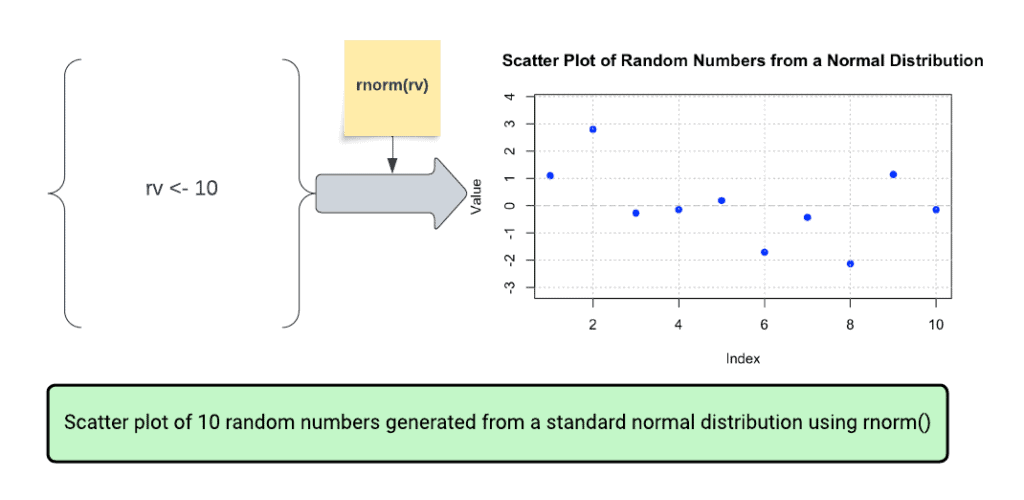
The rnorm() function in R is used to generate a vector of normally distributed random numbers, which are widely used in statistical simulations and data analysis.
You can also use the set.seed() function before using rnorm() to ensure that the same set of random numbers is generated again.
Visual Representation
Syntax
rnorm(n, mean, sd)Parameters
| Name | Description |
| n | Number of observations(sample size). |
| mean | It is a value of the observation data. The default is zero. |
| sd | Standard deviation. Its default value is 1. |
Return value
By default, it returns numbers from a standard normal distribution (mean = 0, standard deviation = 1).
Example 1: Basic usage
data <- rnorm(10)

print(data)
Output
 [1] -1.5360670 0.2471094 -1.1806552 -1.1448586 -0.6113512 0.3448430
 [7] 0.9522712 0.3176696 2.3503968 -0.1918144
As you can see, we generated 10 normally distributed random numbers as sample data.
Example 2: Generating random numbers with custom mean
You can predefine the mean of the random numbers by passing the “mean” argument to the rnorm() function.
# Set the seed for reproducibility
set.seed(123)

# Generate random heights
heights <- rnorm(10, 2)

print(heights)
Output
[1] 1.4395244 1.7698225 3.5587083 2.0705084 2.1292877 3.7150650 2.4609162
[8] 0.7349388 1.3131471 1.5543380
We have 10 observations whose value is around mean 2.
Example 3: Simulating the heights of the human population
Let’s take a real-world example where we want to simulate the heights of 100 men whose average height is 170cm and whose standard deviation is 10. That means we have a mean of 170 and 10 plus or minus, which is sd.
data <- rnorm(100, 170, 10)

print(data)
Output
 [1] 158.2510 180.6479 187.3056 191.6965 194.6436 156.7804 173.1956
 [8] 179.4331 176.0277 164.2596 154.9793 169.3680 165.8675 145.3365
 [15] 195.5529 151.9154 161.6852 171.3717 174.6469 145.7286 161.3719
 [22] 190.5701 167.9142 163.6796 157.5316 172.2447 174.3563 171.3076
 [29] 166.3947 185.0756 167.1701 171.4087 151.0265 163.9975 177.3185
 [36] 176.2810 179.3618 166.9730 166.9589 174.7424 166.5725 181.3311
 [43] 175.2131 152.9896 189.9179 161.2098 171.1099 174.0227 172.7908
 [50] 163.0921 164.6657 163.1869 175.9643 177.6391 178.2297 163.2634
 [57] 168.8777 164.9482 157.1909 175.8665 154.4594 178.2447 172.8234
 [64] 168.0787 168.0108 153.4720 163.0311 154.9616 166.4673 184.2978
 [71] 153.4157 164.4439 180.2366 170.2234 168.1334 167.0586 185.9537
 [78] 169.2638 172.0199 183.1606 162.9529 163.0902 167.0587 181.1529
 [85] 163.2014 174.1792 169.4121 162.7256 169.6268 164.5417 170.7820
 [92] 181.8166 171.0858 181.1536 153.4309 167.6885 170.7262 185.7054
 [99] 174.6625 180.9943
The output shows that most men have a height of around 170 cm because that is the mean value. The standard deviation of 10 means men might have 160 cm or 180 cm, and there will be some outliers.
Let’s plot the chart using ggplot2 based on these values:
# Load the ggplot2 package
library(ggplot2)

# Setting the seed for reproducibility
set.seed(123)

# Generating random heights
heights <- rnorm(100, mean = 170, sd = 10)

# Creating a data frame (ggplot2 works best with data frames)
heights_df <- data.frame(heights = heights)

# Plot the histogram
ggplot(heights_df, aes(x = heights)) +
  geom_histogram(binwidth = 1, fill = "blue", color = "black") +
  labs(title = "Distribution of Simulated Heights",
  x = "Height (cm)",
  y = "Frequency")
Output
We plotted a chart based on the normally distributed heights of men, whose mean value is 170 cm and sd is 10.
Example 4: Generating test scores for a class
Let’s take an example of generating test scores for a class in which a student gets an average of 75. standard deviation of 15 means some students also get around 60 and 90 scores, and some of them have 100 scores which you can count as an outlier.
# Set the seed for reproducibility
set.seed(123)

test_scores <- rnorm(30, mean = 75, sd = 15)

print(test_scores)
Output
[1] 66.59287 71.54734 98.38062 76.05763 76.93932 100.72597 81.91374
[8] 56.02408 64.69721 68.31507 93.36123 80.39721 81.01157 76.66024
[15] 66.66238 101.80370 82.46776 45.50074 85.52034 67.90813 58.98264
[22] 71.73038 59.60993 64.06663 65.62441 49.69960 87.56681 77.30060
[29] 57.92795 93.80722
Here is a code that plots a histogram that represents the normal random distribution of scores:
# Install ggplot2 if it's not already installed
if(!require(ggplot2)){
  install.packages("ggplot2")
  library(ggplot2)
}

# Set the seed for reproducibility
set.seed(123)

# Generate 30 random numbers with mean = 75 and sd = 15
test_scores <- rnorm(30, mean = 75, sd = 15)

# Create a data frame from the test scores
test_scores_df <- data.frame(score = test_scores)

# Plot the histogram using ggplot2
ggplot(test_scores_df, aes(x = score)) +
  geom_histogram(binwidth = 5, fill = "green", color = "black") +
  ggtitle("Histogram of Simulated Test Scores") +
  xlab("Test Score") +
  ylab("Frequency")
Output
We have used a histogram to show the random distribution of test scores and you can see I pointed out which is mean, sd, and outliers in the above chart.

Krunal Lathiya is a seasoned Computer Science expert with over eight years in the tech industry. He boasts deep knowledge in Data Science and Machine Learning. Versed in Python, JavaScript, PHP, R, and Golang. Skilled in frameworks like Angular and React and platforms such as Node.js. His expertise spans both front-end and back-end development. His proficiency in the Python language stands as a testament to his versatility and commitment to the craft.


Pretty! This was an incredibly wonderful article.
Thanks for supplying these details.