Overview
Before diving into the as.factor() function, let’s understand categorical data and why it is helpful in statistical analysis.
Categorical data is data that is divided into groups and categories that are distinct from each other. For example, colors (red, green, blue), brands (Nike, Puma, Asics), or types of cuisine (Italian, Chinese, Indian) are categories.
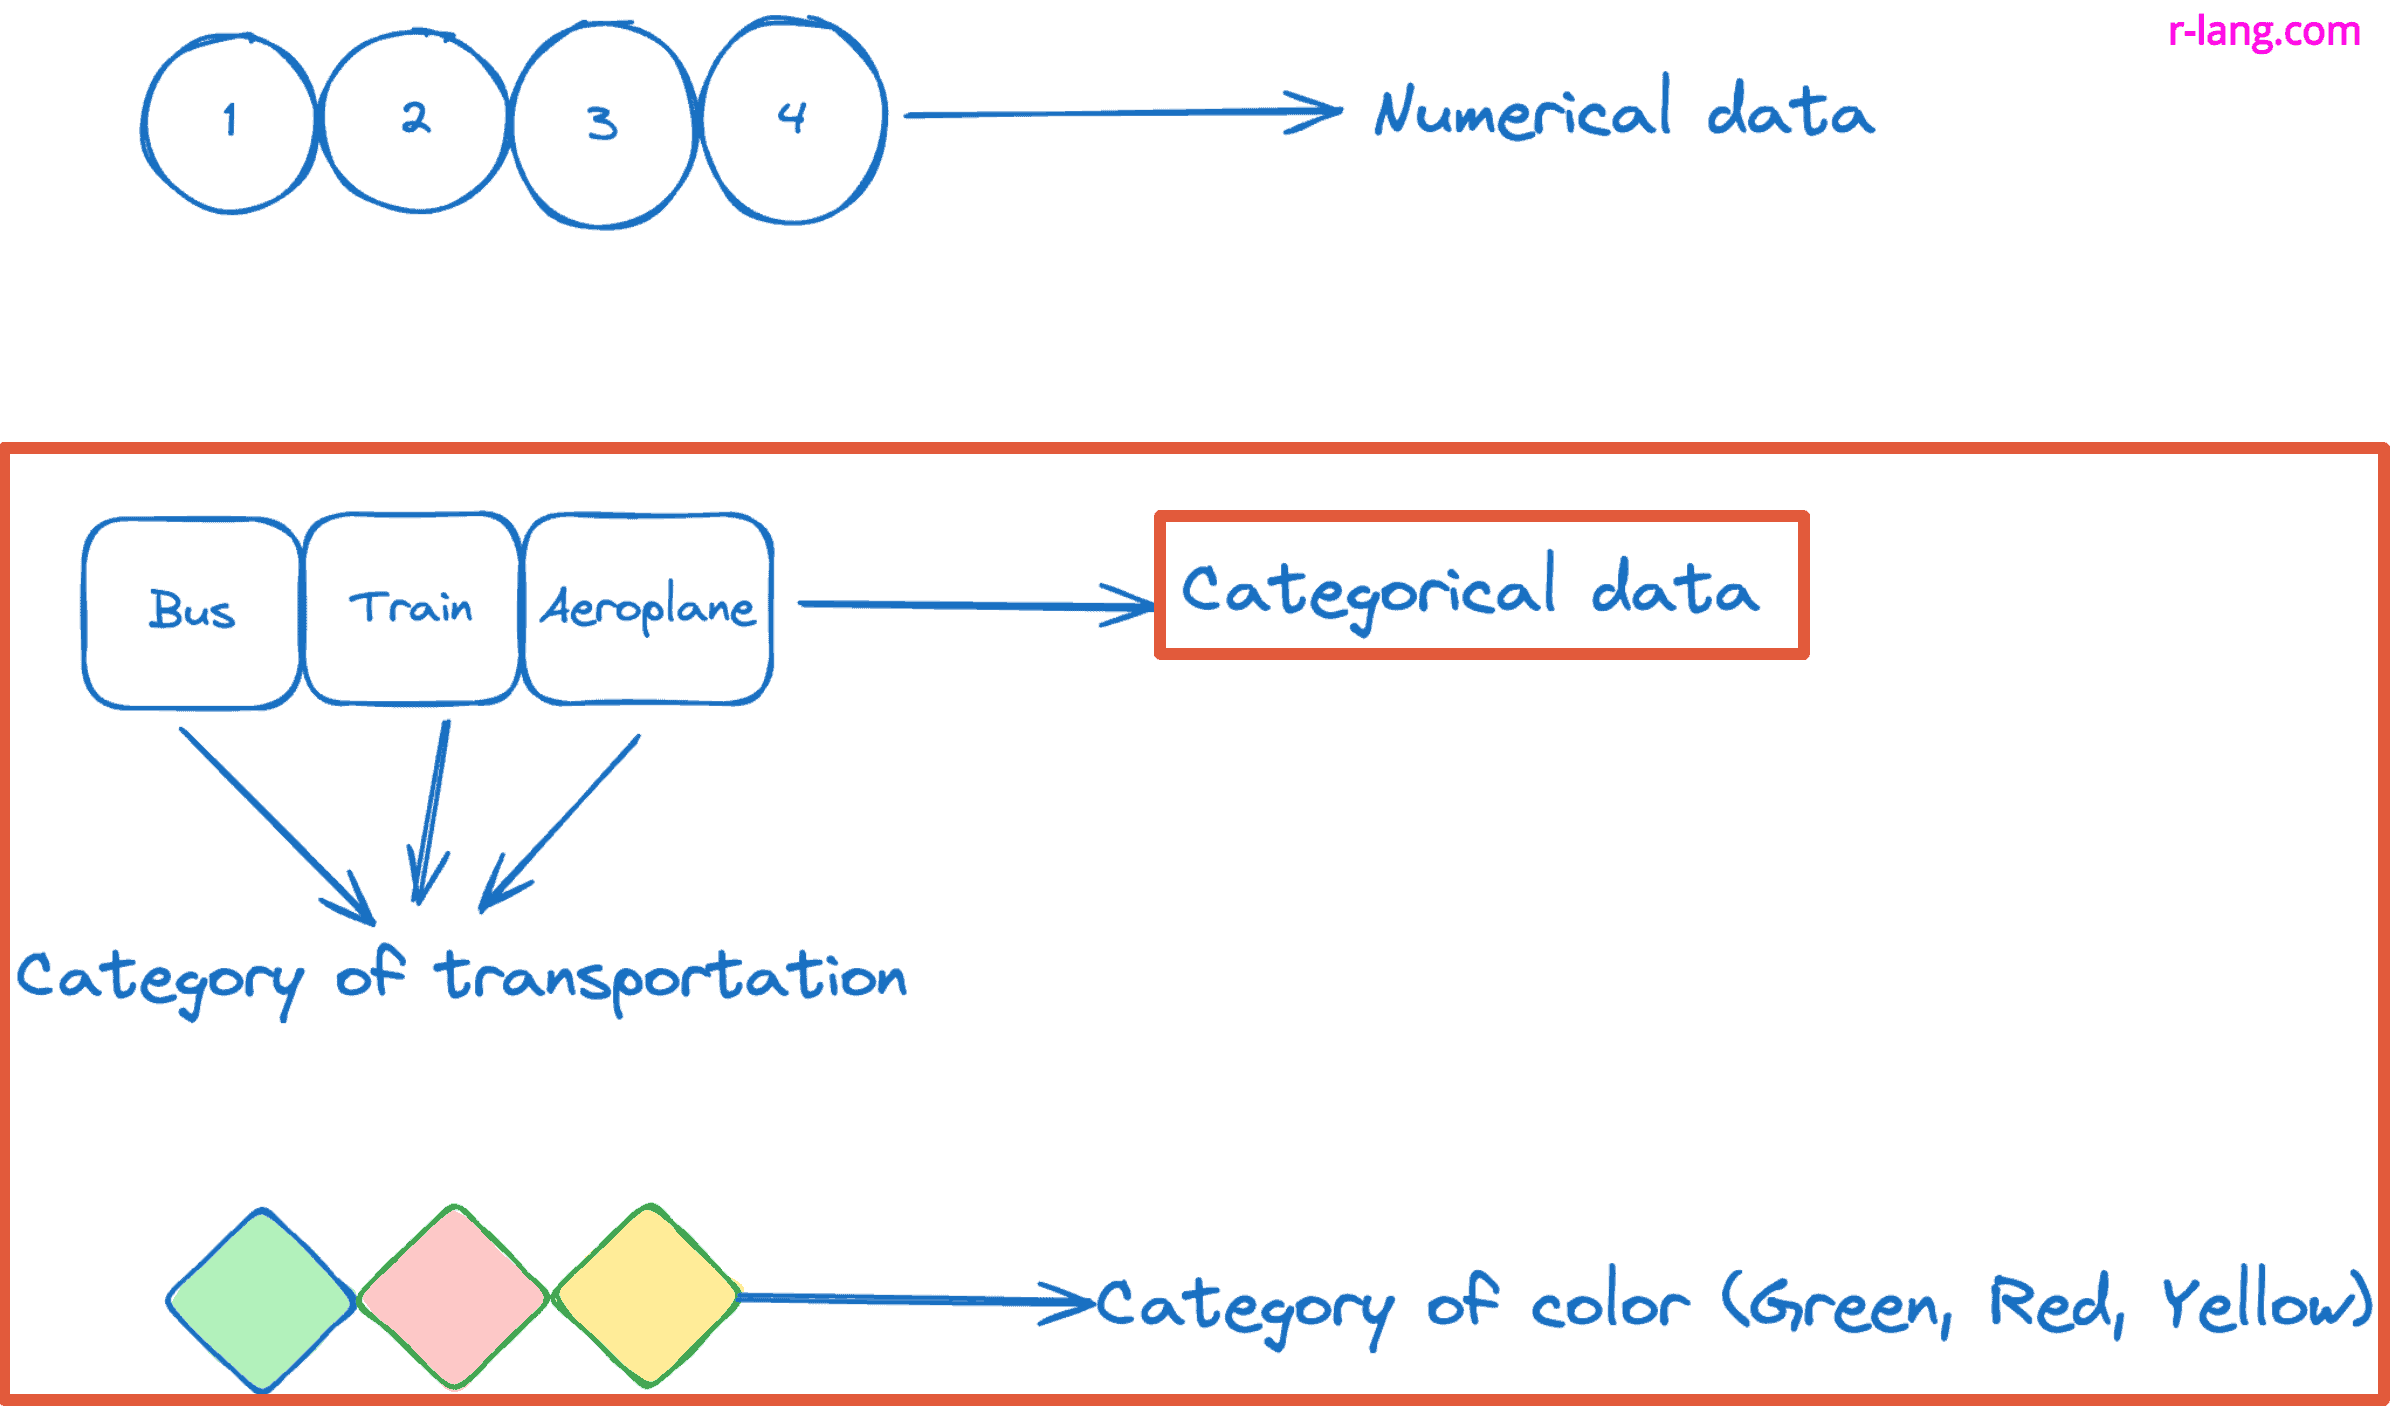
As you can see in the above figure, we defined two types of data:
- Numerical data: It consists of numbers or numeric values.
- Categorical data: It consists of labels you can divide into specific groups or categories, such as mode of transportation and colors.
The main difference between numerical and categorical data is that numerical data can be ordered meaningfully, whereas categorical data represents characteristics or attributes and is often descriptive in nature.
Factors are helpful in statistical modeling because they help in handling categorical data accurately.
What is the as.factor() function?
The as.factor() function converts a vector object to a factor in R.
In other words, you have a vector of t-shirt size, and you want R to identify “Small”, “Medium”, or “Large” as distinct categories rather than just text.
Syntax
as.factor(input)Parameters
| Name | Description |
| input (required) | It is a vector object. |
Return value
It returns a factor object.
Example 1: Converting numeric vector to factor
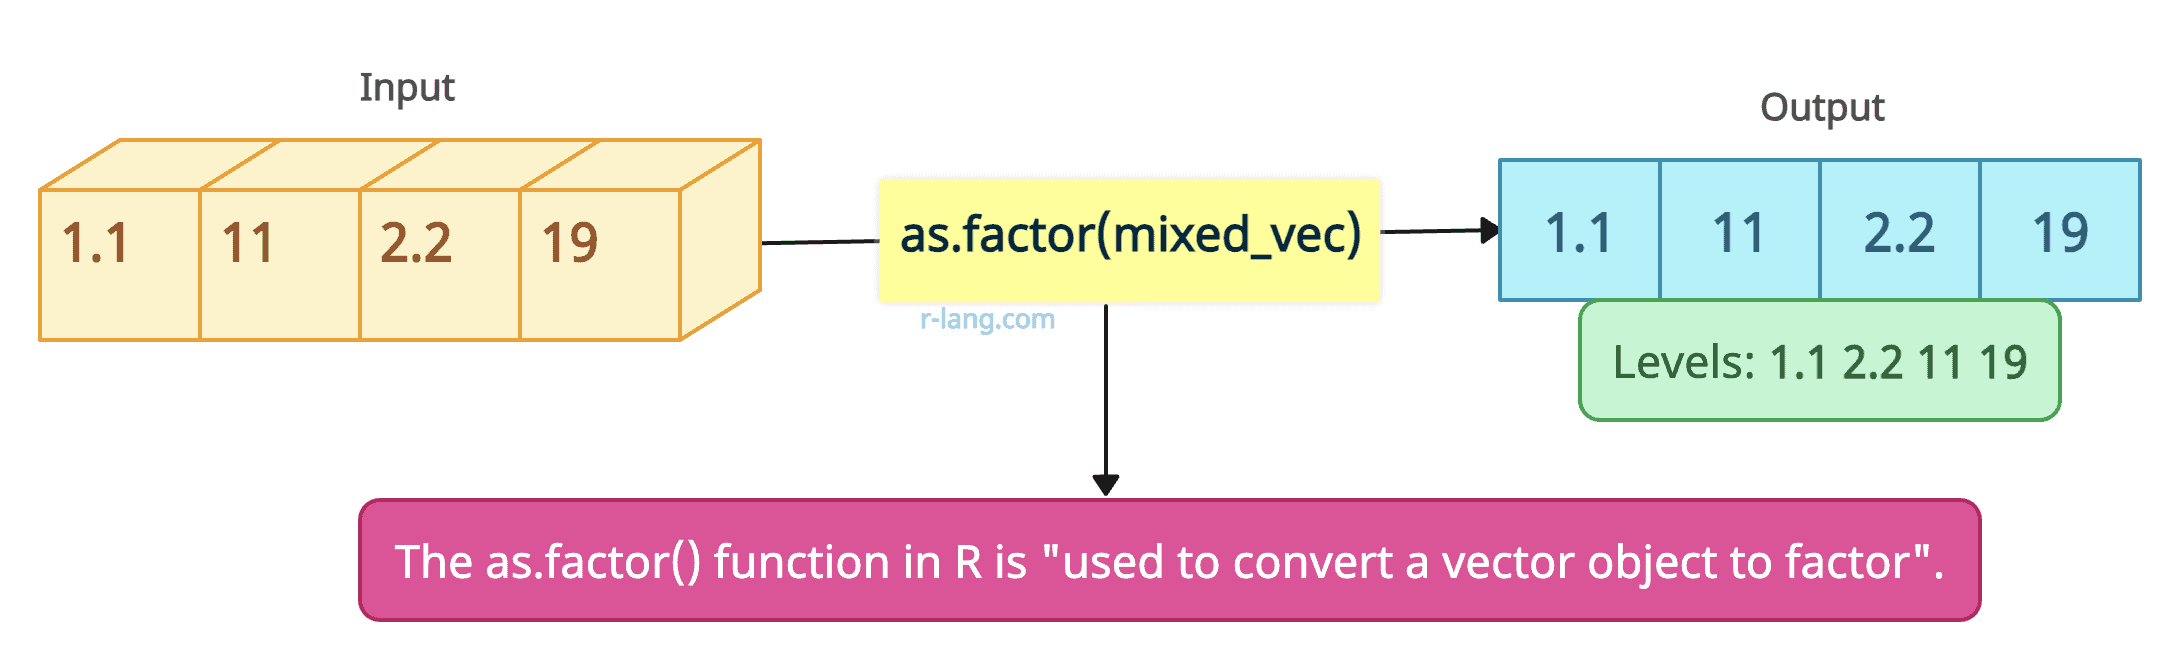
The above figure shows that we convert a numeric vector to a factor, and each unique value of a vector becomes the level of the factor.
mixed_vec <- c(1.1, 11, 2.2, 19)

as.factor(mixed_vec)
Output
[1] 1.1 11 2.2 19
Levels: 1.1 2.2 11 19
Example 2: Converting character vector to factor
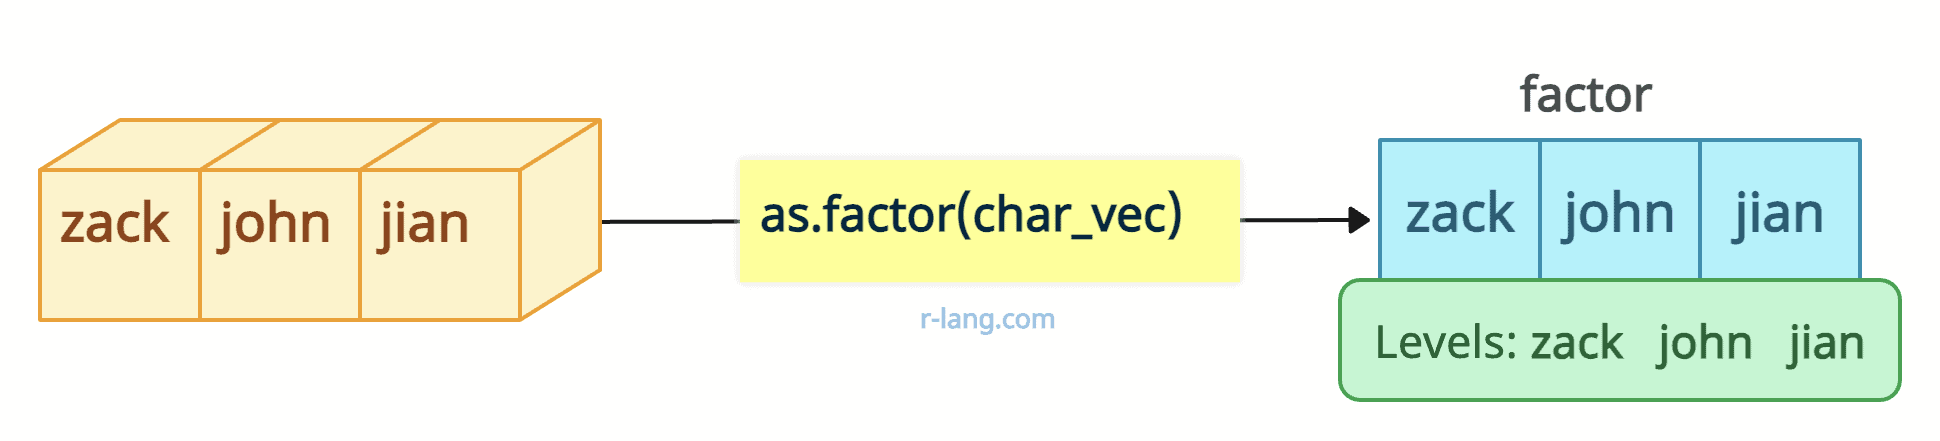
In the above figure, the as.factor() function converts each unique character of a character vector into the level of the factor.
char_vec <- c("zack", "john", "jian")

as.factor(char_vec)
Output
[1] zack john jian
Levels: jian john zack
Example 3: Converting data frame column to factor
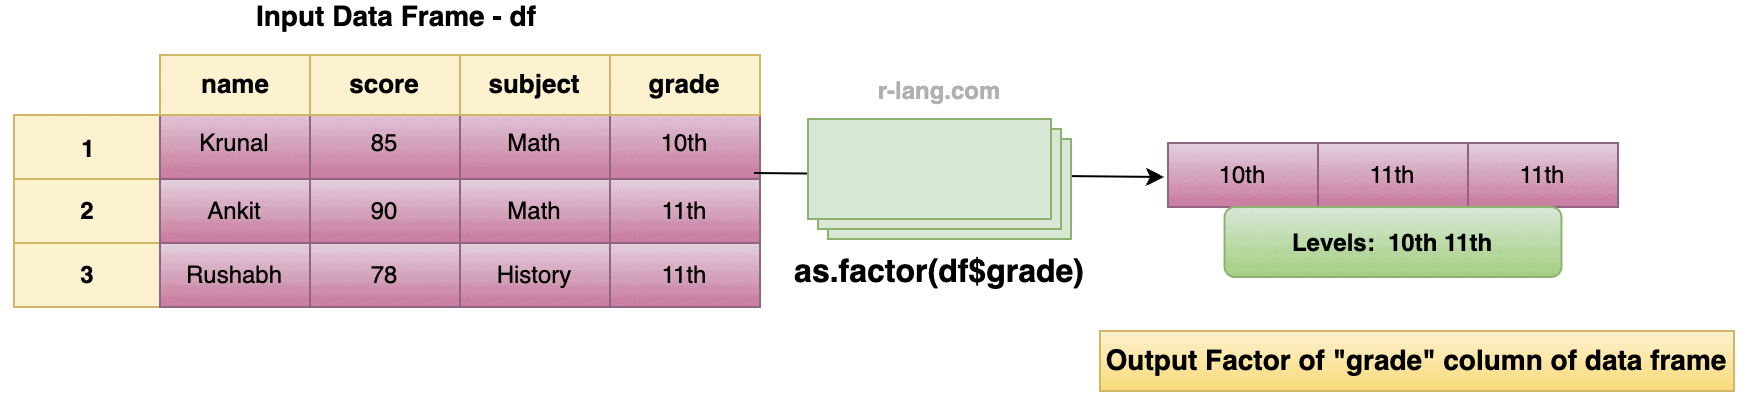
The above figure shows that as.factor() function converts a single column of the data frame to a factor.
df <- data.frame(
  name = c("Krunal", "Ankit", "Rushabh"),
  score = c(85, 90, 78),
  subject = c("Math", "Math", "History"),
  grade = c("10th", "11th", "11th")
)

df$grade <- as.factor(df$grade)

print(df$grade)
Output
[1] 10th 11th 11th
Levels: 10th 11th
That’s all!

Krunal Lathiya is a seasoned Computer Science expert with over eight years in the tech industry. He boasts deep knowledge in Data Science and Machine Learning. Versed in Python, JavaScript, PHP, R, and Golang. Skilled in frameworks like Angular and React and platforms such as Node.js. His expertise spans both front-end and back-end development. His proficiency in the Python language stands as a testament to his versatility and commitment to the craft.