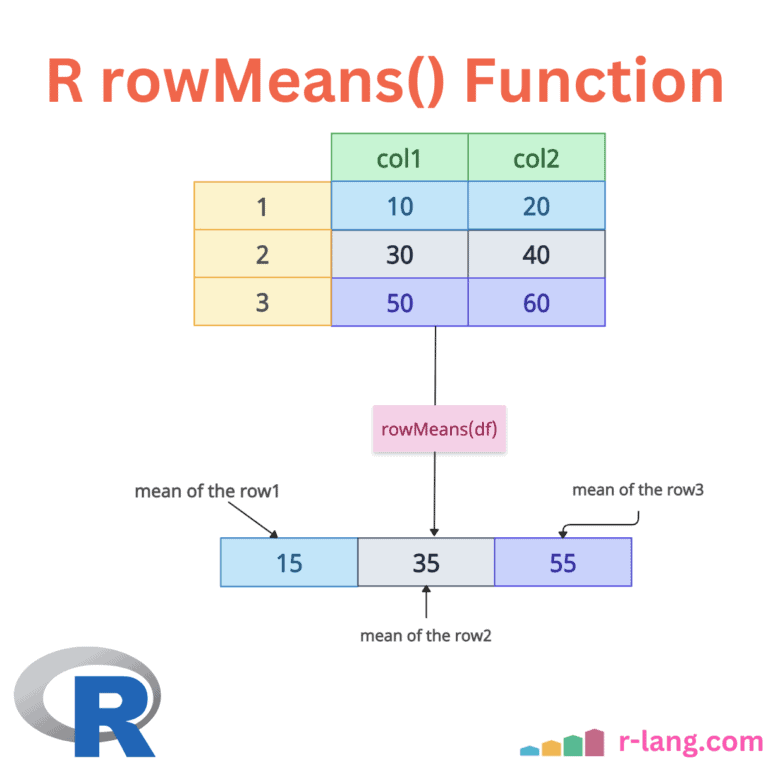
The rowMeans() is a built-in, highly vectorized function in R that computes the arithmetic mean of values in each row of a numeric matrix or a data frame (with numeric-like columns).
Ensure that the object passed to rowMeans() is numeric or can be coerced to numeric. If it contains non-numeric columns, it will throw an error.
Also, the input should have at least two dimensions. For example, if it is a vector, it will throw the error as well.
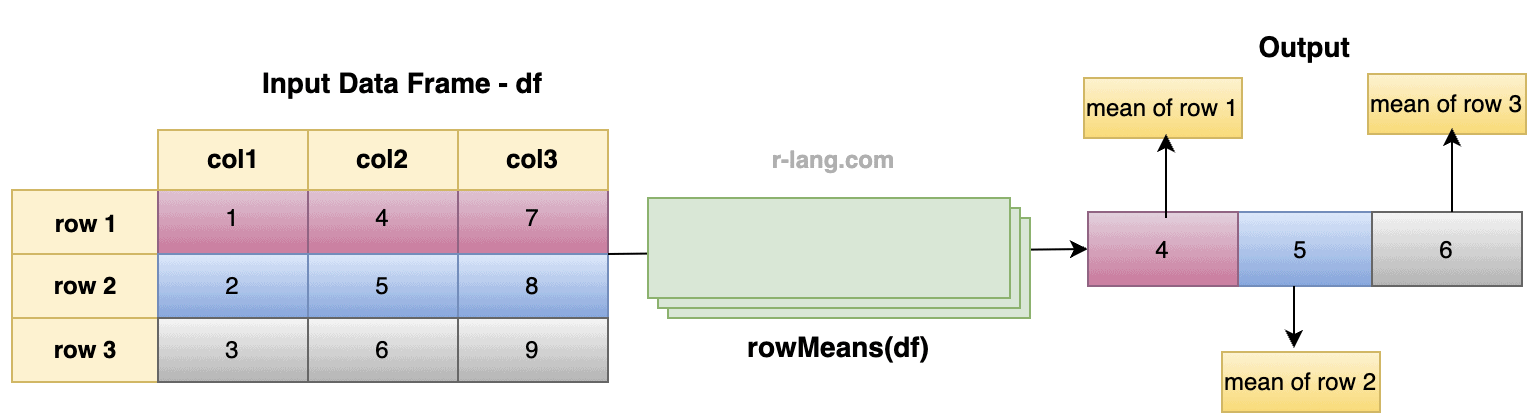
In the above figure, we find the mean of each row.
Mean of the first row: 1 + 4 + 7 / 3 = 12/3 = 4
Mean of the second row: 2 + 5 + 8 / 3 = 15 / 3 = 5
Mean of the third row: 3 + 6 + 9 / 3 = 18 / 3 = 6
Here is the program:
# Creating a data frame
df <- data.frame(
  row1 = c(1, 2, 3),
  row2 = c(4, 5, 6),
  row3 = c(7, 8, 9)
)
print(df)

# Calculating the mean of every row using rowMeans() function
rowMeans(df)

# Output: [1] 4  5  6
Syntax
rowMeans(x, na.rm = FALSE, dims = 1)Parameters
| Argument | Description |
| x | It represents an array of two or more dimensions containing numeric, complex, integer, or logical values or a numeric data frame. |
| na.rm | It represents a logical argument that specifies where NA values should be ignored or not.
If TRUE, NA values will be ignored. If FALSE, NA values will be included. |
| dims | If your input contains higher-dimensional arrays, this argument is relevant.
If you pass dims = 1, it operates across the first dimension (rows). |
Handling NA values

As you can see from the figure, we get the output NA for every row because every row contains NA values.
# Data frame with NA values
df <- data.frame(
  col1 = c(NA, 2, 3),
  col2 = c(4, NA, 6),
  col3 = c(7, 8, NA)
)

rowMeans(df)

# Output: [1] NA NA NA
You can exclude NA values while calculating the mean of every row by passing the na.rm = TRUE parameter.

# Create a data frame.
df <- data.frame(
  col1 = c(NA, 2, 3),
  col2 = c(4, NA, 6),
  col3 = c(7, 8, NA)
)

# Calculate the mean of data frame
rowMeans(df, na.rm = TRUE)

# Output: [1] 5.5   5.0   4.5
Calculating the mean of specific rows
To calculate the mean of specific rows, you need to use row indexing and pass their index to the method.

df <- data.frame(
  col1 = c(1, 2, 3),
  col2 = c(4, 5, 6),
  col3 = c(7, 8, 9)
)

rowMeans(df[c(1, 3), ])

# Output:
# 1    3
# 4    6
For row 1, the mean is 4, and for row 2, the mean is 6.
Working with a matrix
Matrix has rows and columns, and it works the same as a data frame because if you create a matrix with the same values as the above data frame, the output will be the same.

# Create a matrix.
mat <- matrix(1:9, 3, 3)

print(mat)

# Calculate the mean of each row.
cat("The mean of every row of matrix: ", rowMeans(mat), "\n")

# Output: The mean of every row of matrix: 4   5   6
Matrix with a single row
If your input is a matrix with a single row, the output will have only the row’s mean.
single_row <- matrix(5:8, nrow = 1)

print(single_row)

rowMeans(single_row)

# Output: [1] 6.5
Empty input
If your input is an empty data frame or matrix, the output will be numeric(0).
empty_mat <- matrix(numeric(0), nrow = 0, ncol = 2)

rowMeans(empty_mat)

# Output: numeric(0)
That’s it!

Krunal Lathiya is a seasoned Computer Science expert with over eight years in the tech industry. He boasts deep knowledge in Data Science and Machine Learning. Versed in Python, JavaScript, PHP, R, and Golang. Skilled in frameworks like Angular and React and platforms such as Node.js. His expertise spans both front-end and back-end development. His proficiency in the Python language stands as a testament to his versatility and commitment to the craft.