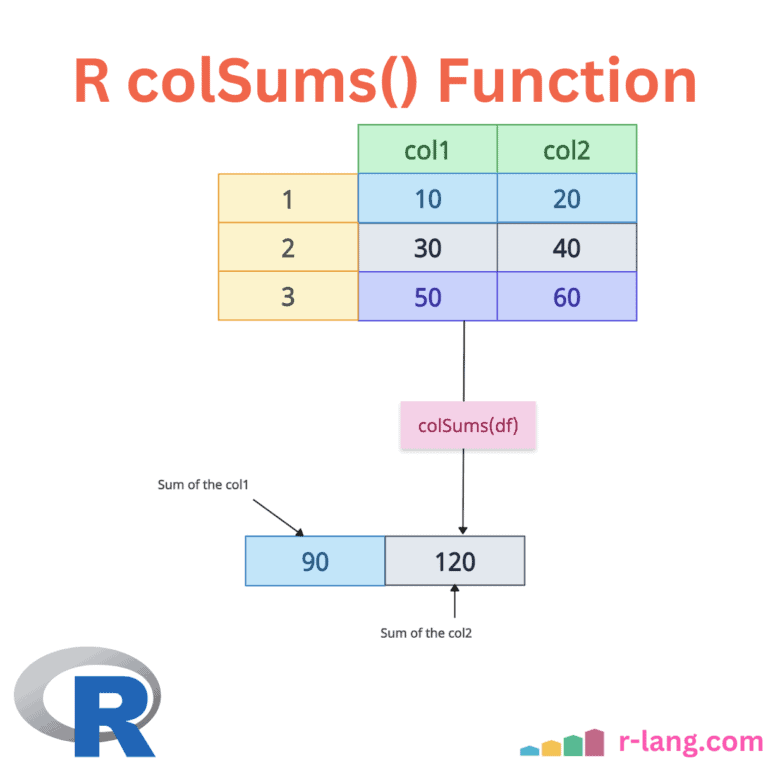
The colSums() function in R calculates the sums of columns for numeric matrices, data frames, or arrays.
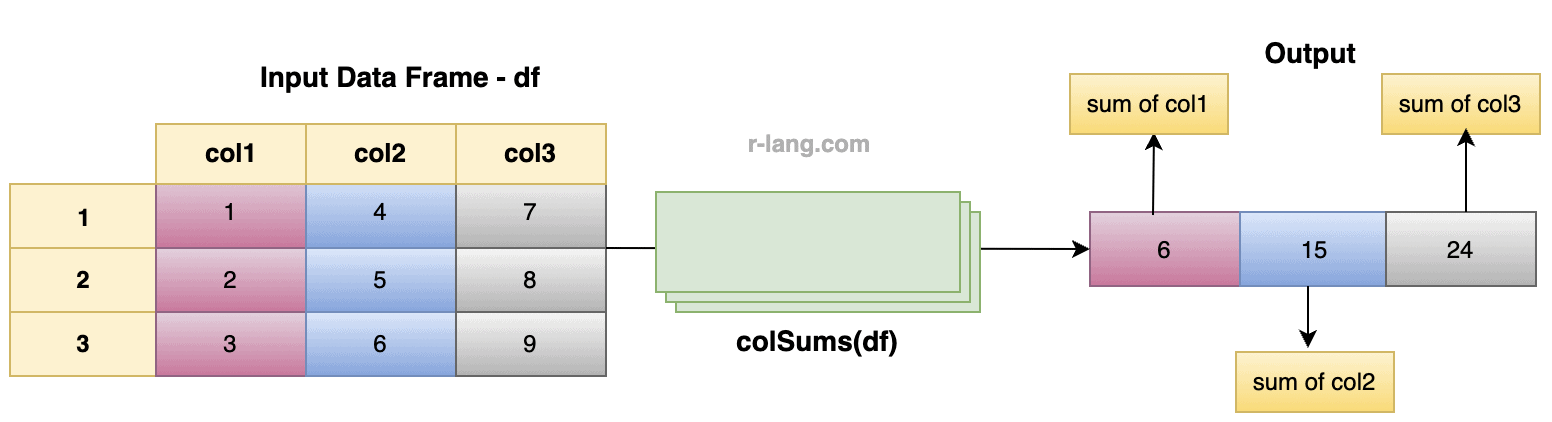
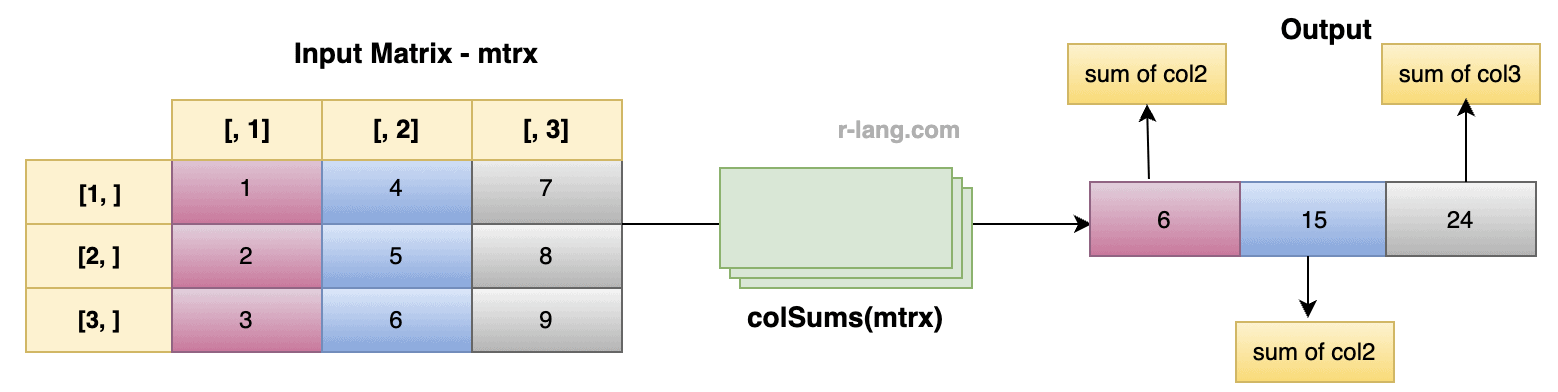
In this figure, we calculated the sum of each column in the data frame.
For col1, the sum of values is (1 + 2 + 3) 6. For col2, the sum of values is (4 + 5 + 6) 15. For col3, the sum of values is (7 + 8 + 9) 24.
# Creating a data frame
df <- data.frame(
  col1 = c(1, 2, 3),
  col2 = c(4, 5, 6),
  col3 = c(7, 8, 9)
)

# Calculate the column sums.
colSums(df)

# Output:
# col1   col2   col3
# 6       15     24
Syntax
colSums(x, m, n, na.rm = FALSE) Parameters
| Argument | Description |
| x | It is an array of two or more dimensions containing numeric, complex, integer, or logical values or a numeric data frame. |
| na.rm | It is logical. Should missing values (including NA or NaN) be omitted from the calculations? |
| dims |
It specifies which dimensions are treated as “columns” to sum over. |
| n, m |
It represents the number of rows (m) and columns (n) in the data frame df or matrix x. |
Handling NA Values
If the NA value is found in a specific column of a data frame, the colSums() function will return NA for that column.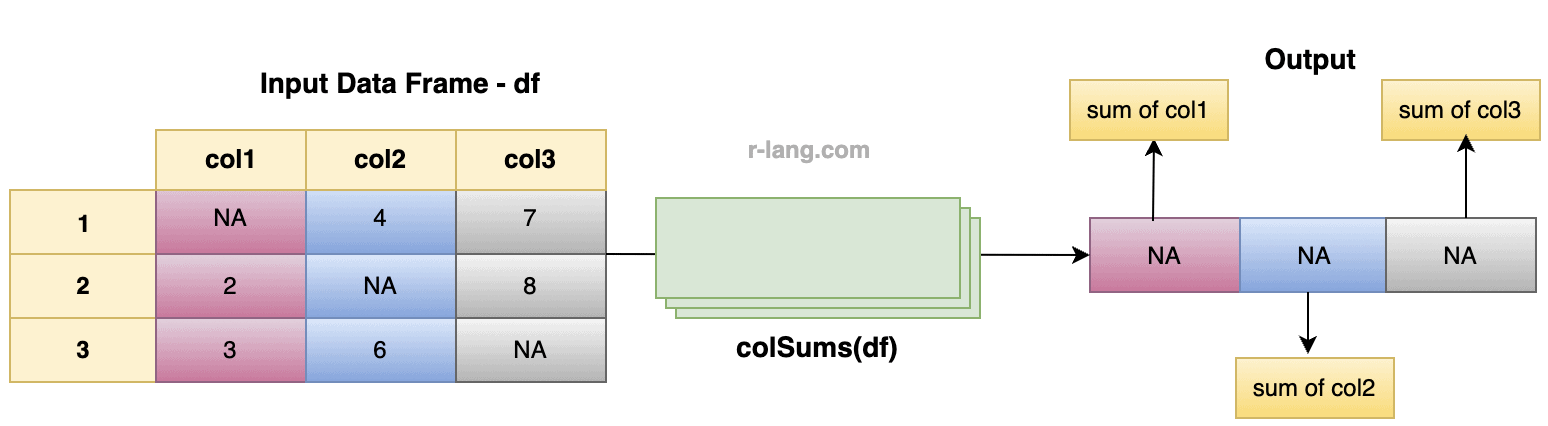
# Create a data frame.
df <- data.frame(
  col1 = c(NA, 2, 3),
  col2 = c(4, NA, 6),
  col3 = c(7, 8, NA)
)

# Calculate the column sums.
colSums(df)

# Output:
# col1    col2    col3
#  NA      NA      NA
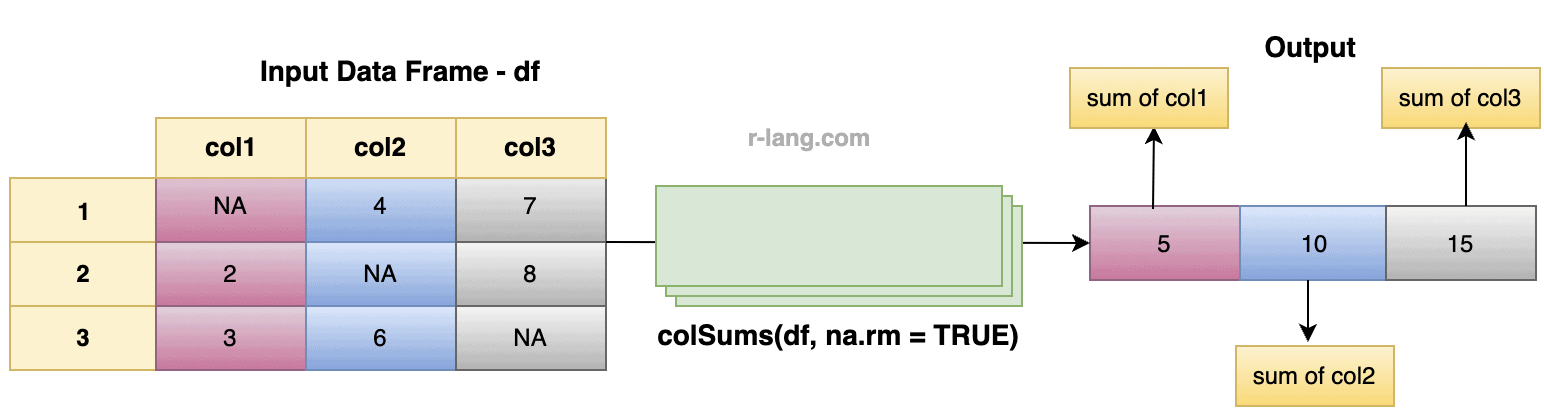
You can exclude NA values from the data frame by passing the na.rm = TRUE parameter.
# Create a data frame.
df <- data.frame(
  col1 = c(NA, 2, 3),
  col2 = c(4, NA, 6),
  col3 = c(7, 8, NA)
)

# Calculate the column sums.
colSums(df, na.rm = TRUE)

# Output
# col1    col2   col3
#  5      10      15
Usage with specific columns
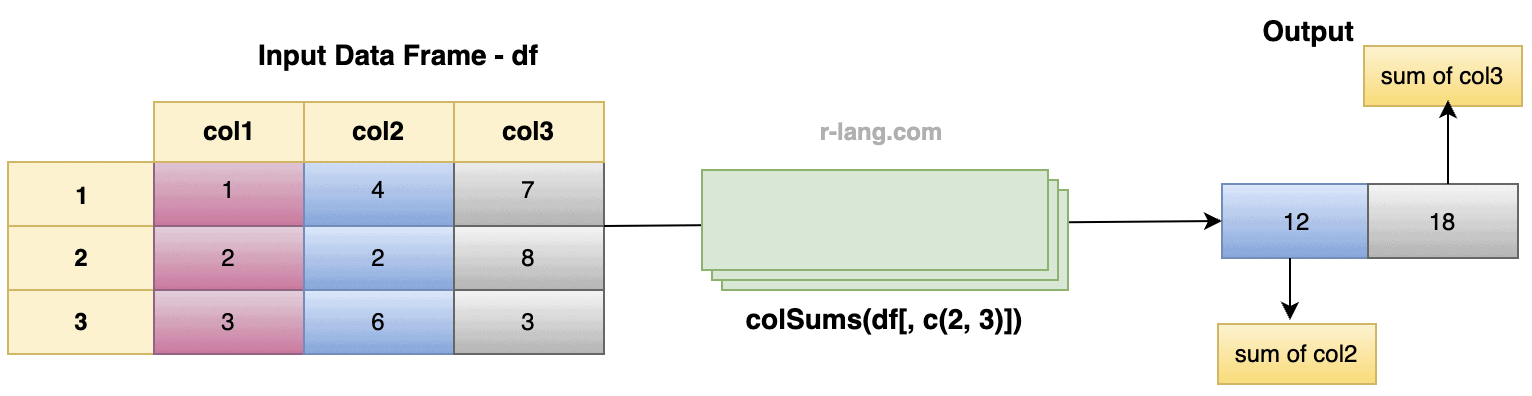
We can use the indexing to calculate the sum of specific columns. Pass the column index to the colSums() function, and it will return the sum for the respective columns.
# Create a data frame.
df <- data.frame(
  col1 = c(1, 2, 3),
  col2 = c(4, 2, 6),
  col3 = c(7, 8, 3)
)

# Calculate the column sums.
colSums(df[, c(2, 3)])

# Output
# col2    col3
#  12      18
Usage with Matrix
Since a matrix also has rows and columns, we can find the sum of individual columns by passing the matrix to the colSums() function.
mtrx <- matrix(rep(1:9), 3, 3)
mtrx
cat("The sum of columns is: ", "\n")
colSums(mtrx)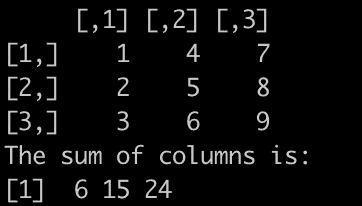
Higher-Dimensional Arrays
When you are working with high-dimensional arrays, the dims argument specifies how many of the leading dimensions you want to keep, and the function will sum over all the trailing dimensions.
For example, with a 4D array shaped (a, b, c, d), using colSums(x, dims = 2) keeps the first two dimensions (a, b) and sums over (c, d).
Increasing the value of dims reduces the amount of collapsing, while smaller values collapse more dimensions together.
arr <- array(1:24, dim = c(2, 3, 4)) # 2 rows, 3 columns, 4 slices

colSums(arr, dims = 1)

# Output:
#      [,1] [,2]  [,3]  [,4]
# [1,]  3   15    27    39
# [2,]  7   19    31    43
# [3,]  11  23    35    47

colSums(arr, dims = 2) # Sum over rows and columns (dims=2), result: 4-vector

# Output:
#       [,1]  [,2]  [,3]  [,4]
# [1,]   3     15    27    39
# [2,]   7     19    31    43
# [3,]  11     23    35    47
# [1]   21     57    93   129
In the code arr <- array(1:24, dim = c(2, 3, 4)), we create a 3D array with two rows, three columns, and four slices.
When we call colSums(arr, dims = 1), the first dimension (rows) is preserved, and the function sums over the remaining dimensions (columns and slices).
This results in a 3×4 matrix, where each entry is the sum of values aligned across columns and slices for a given row.
On the other hand, colSums(arr, dims = 2) preserves both the row and column dimensions and collapses over the slice dimension, effectively summing across all slices.
This produces a 2×3 matrix, showing the total sums for each row-column position across all slices.
Calculating the sum of column values in the Data Set
You can use the built-in dataset, like ChickWeight, and calculate the sum of its column values.
But first, let’s get a snapshot of the ChickWeight dataset using the head() function.
head(USArrests, 5)Output
          Murder Assault UrbanPop  Rape
Alabama    13.2    236     58      21.2
Alaska     10.0    263     48      44.5
Arizona     8.1    294     80      31.0
Arkansas    8.8    190     50      19.5
California  9.0    276     91      40.6
We will calculate the sum of Murder, Assult, UrbanPop, and Rape column values.
colSums(USArrests)Output
Murder  Assault  UrbanPop   Rape
389.4   8538.0    3277.0   1061.6
Ensure that the object passed to this function is numeric or can be coerced to numeric. If it contains non-numeric columns, it will throw an error.

Krunal Lathiya is a seasoned Computer Science expert with over eight years in the tech industry. He boasts deep knowledge in Data Science and Machine Learning. Versed in Python, JavaScript, PHP, R, and Golang. Skilled in frameworks like Angular and React and platforms such as Node.js. His expertise spans both front-end and back-end development. His proficiency in the Python language stands as a testament to his versatility and commitment to the craft.