Latest Blog Post
R scale(): Scaling and Centering of Matrix-like Objects
The scale() function in R centers (subtracting the mean) and/or scales (dividing by the standard …

file.rename(): Renaming Single and Multiple Files in R
To rename a file in R, you can use the file.rename() function. It renames a …
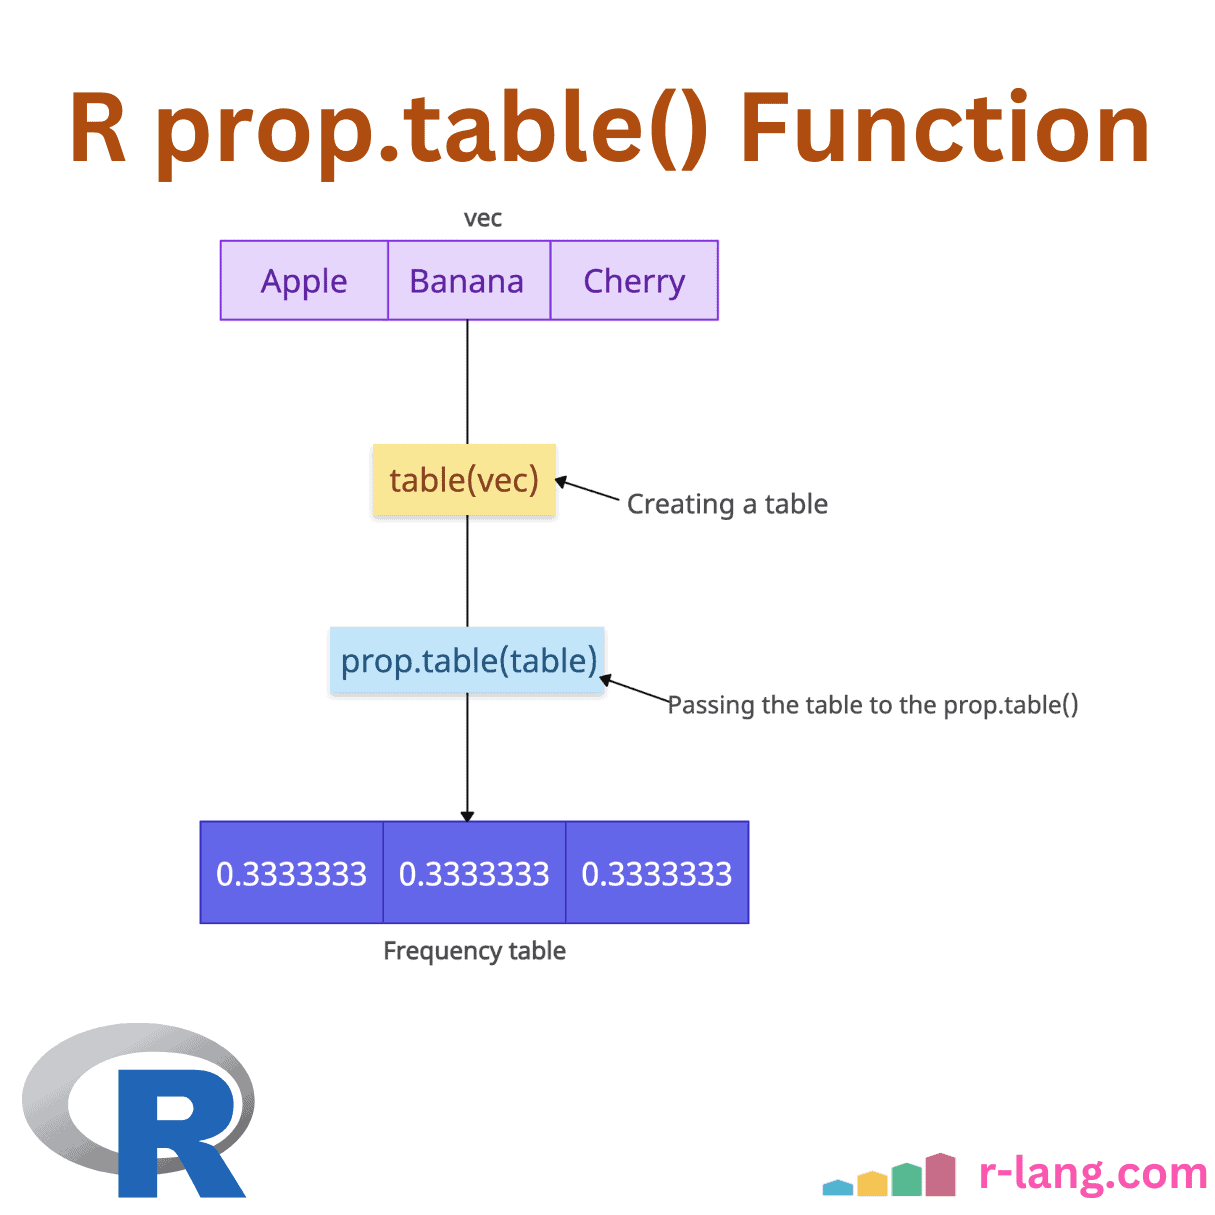
R prop.table() Function
The prop.table() function in R calculates the proportion or relative frequency of values in a …
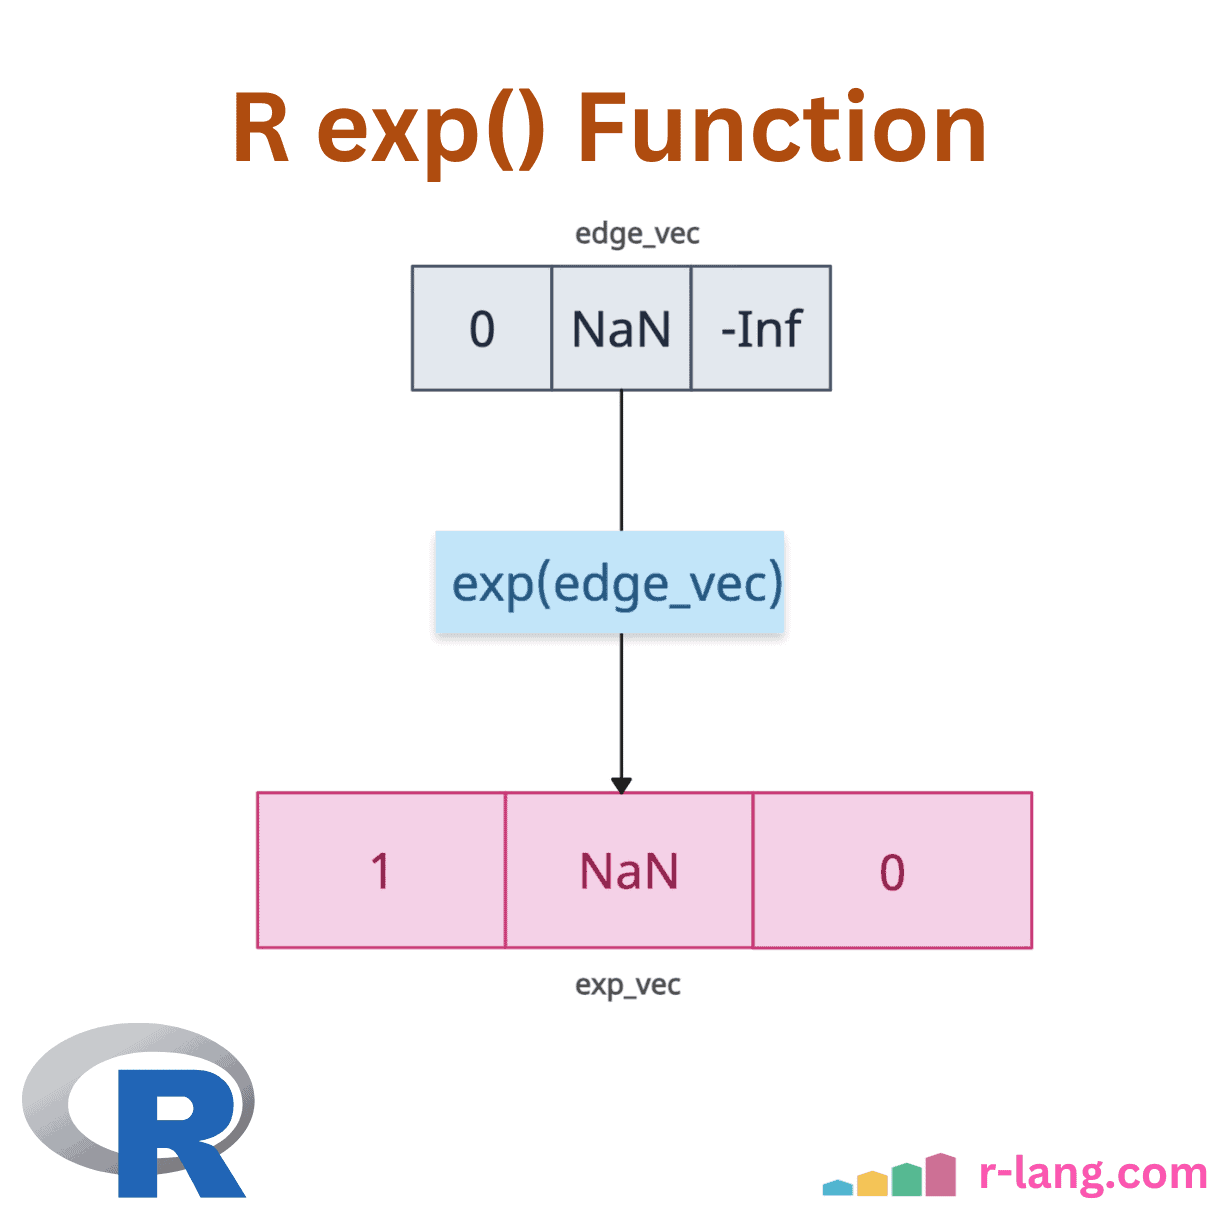
exp() Function: Calculate Exponential of a Number in R
The exp() is a built-in function that calculates the exponential of its input, raising Euler’s …
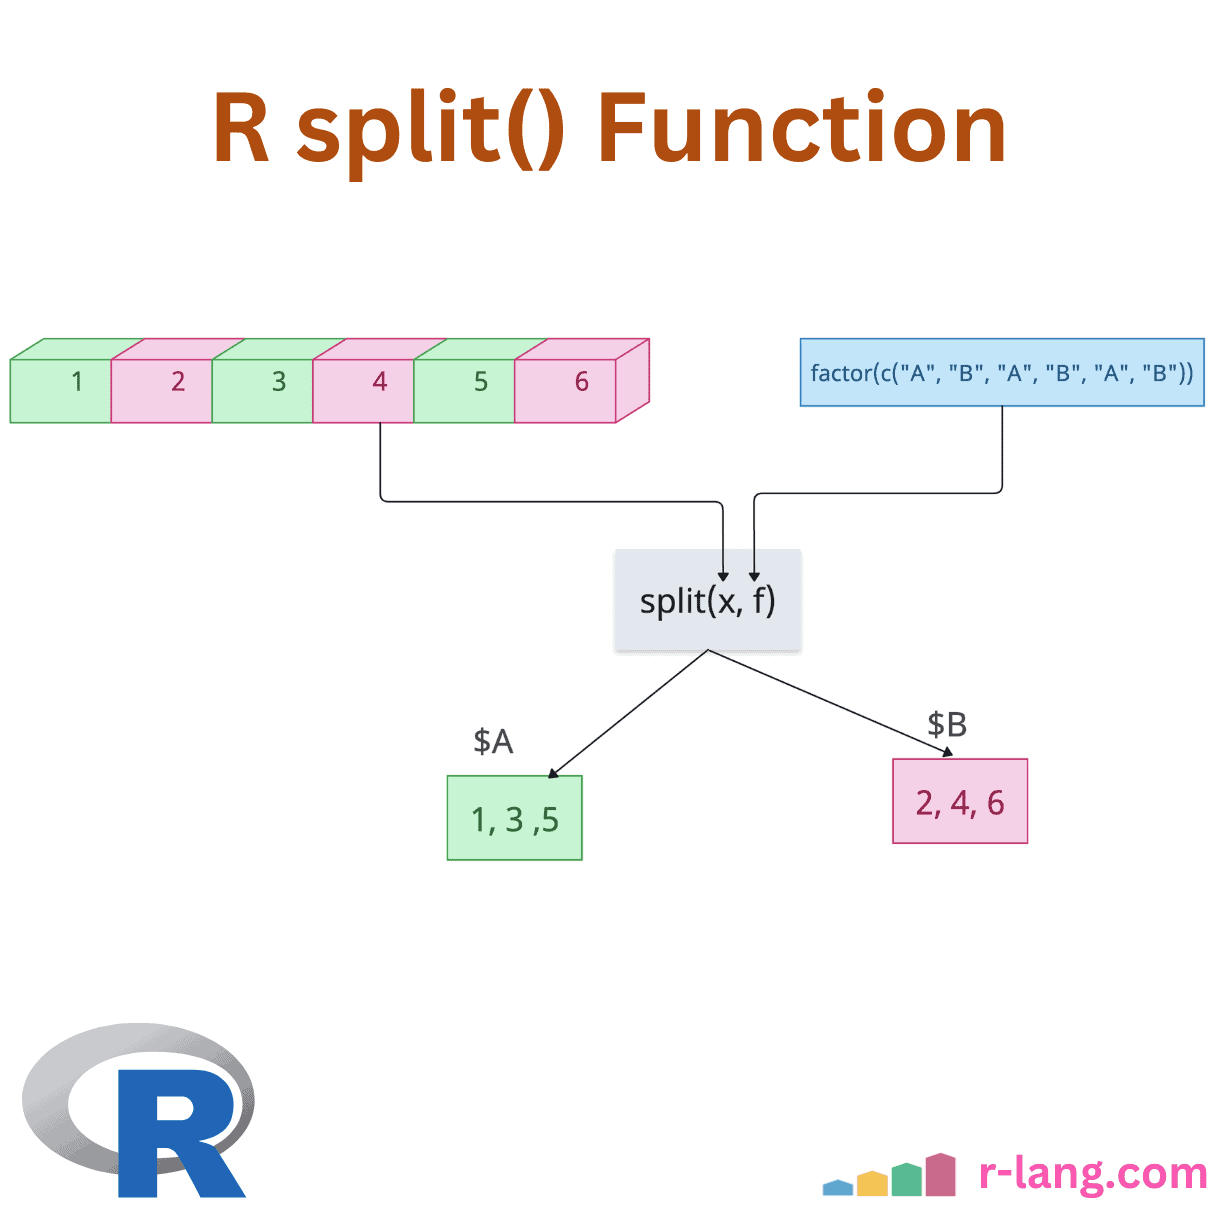
R split() Function: Splitting a Data
The split() function divides the input data into groups based on some criteria, typically specified …
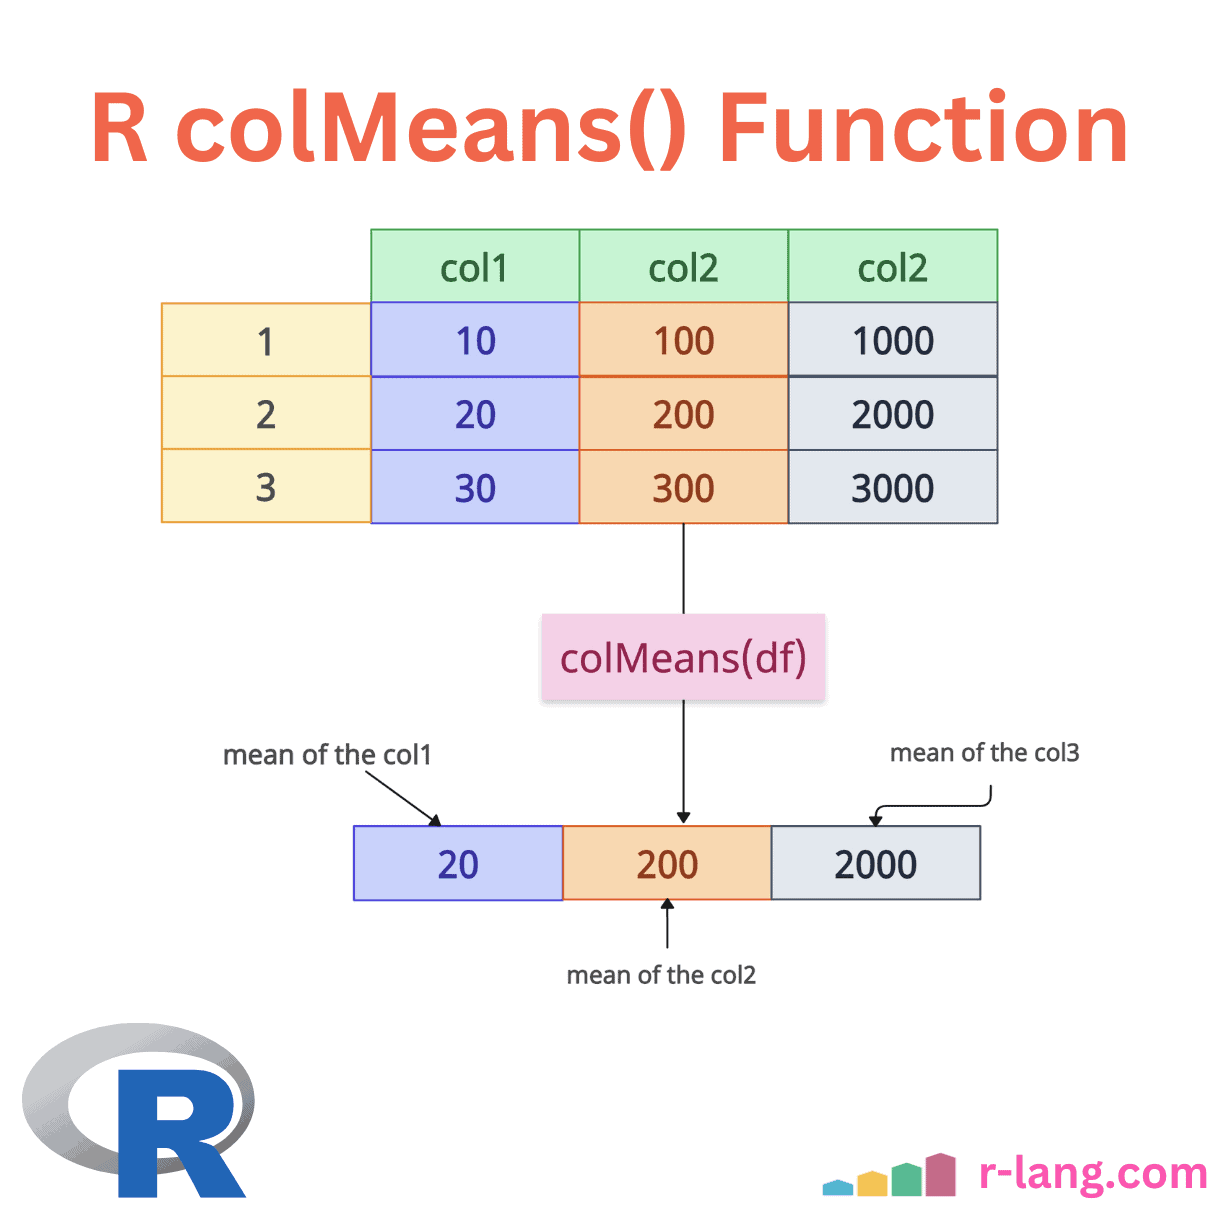
colMeans(): Calculating the Mean of Columns in R Data Frame
The colMeans() function in R calculates the arithmetic mean of columns in a numeric matrix, …