Calculating Absolute Value using abs() Function in R
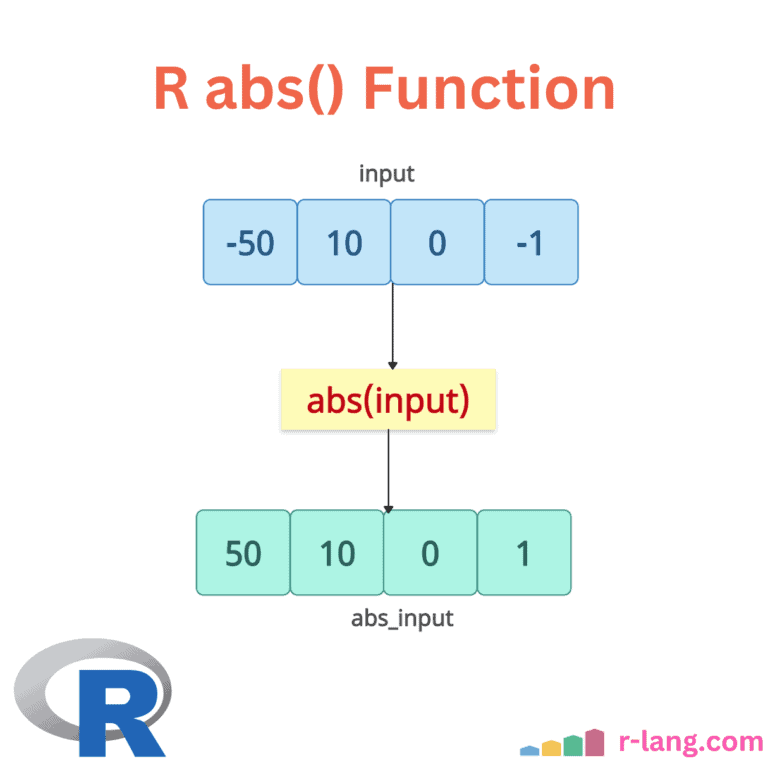
The abs() function calculates the absolute value of a numeric input, returning a non-negative (only positive) value by removing any sign. Usage of absolute value is high in fields like mathematical computations (mean absolute errors), statistical analysis, and data cleaning in ML tasks. Syntax abs(input) Parameters Argument Description input It defines the input object. It … Read more