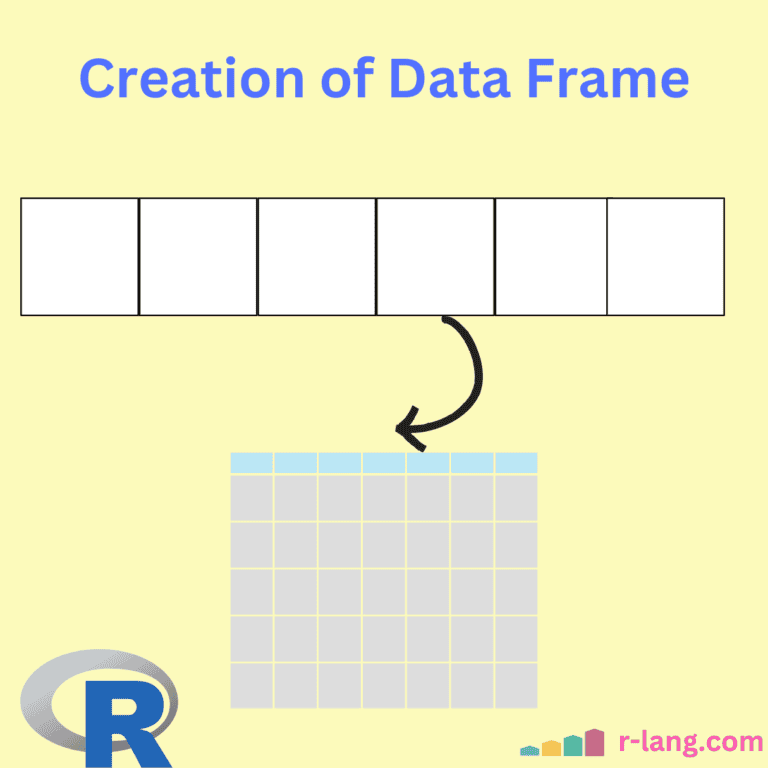
To create a data frame from vectors in R, use the data.frame() function and pass the vectors. Ensure you have the same length of all the vectors; otherwise, it throws an error.

The above figure shows five vectors. Each vector has its own type and the same length, which is five. After converting vectors to a data frame, each vector becomes a column of the data frame.
After the data frame has been created, each column retains its data type.
You can think of a vector as a series of values in a single column. It contains the same data type. Each column of a data frame is a vector. Therefore, if I have several vectors, I can combine them to create a data frame.
Basic Data Frame Creation
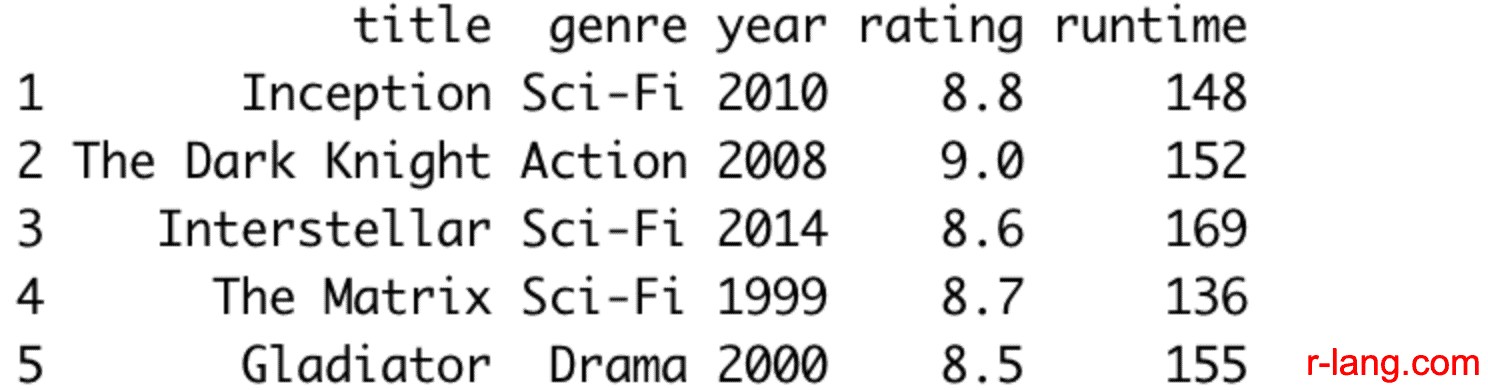
Let’s define the five vectors, which will act as columns of the data frame, and then pass them to the data.frame() method.
title <- c("Inception", "The Dark Knight", "Interstellar", "The Matrix", "Gladiator")
genre <- c("Sci-Fi", "Action", "Sci-Fi", "Sci-Fi", "Drama")
year <- c(2010, 2008, 2014, 1999, 2000)
rating <- c(8.8, 9.0, 8.6, 8.7, 8.5)
runtime <- c(148, 152, 169, 136, 155)


# Create a data frame from vectors
df <- data.frame(title, genre, year, rating, runtime)

print(df)
Output
Displaying the internal structure of the data frame
If you want to implement the internal structure of the data frame, you can use the “str()” function and pass the data frame to it.
title <- c("Inception", "The Dark Knight", "Interstellar", "The Matrix", "Gladiator")
genre <- c("Sci-Fi", "Action", "Sci-Fi", "Sci-Fi", "Drama")
year <- c(2010, 2008, 2014, 1999, 2000)
rating <- c(8.8, 9.0, 8.6, 8.7, 8.5)
runtime <- c(148, 152, 169, 136, 155)


# Create a data frame from vectors
df <- data.frame(title, genre, year, rating, runtime)

# Printing data frame structure
str(df)
Output
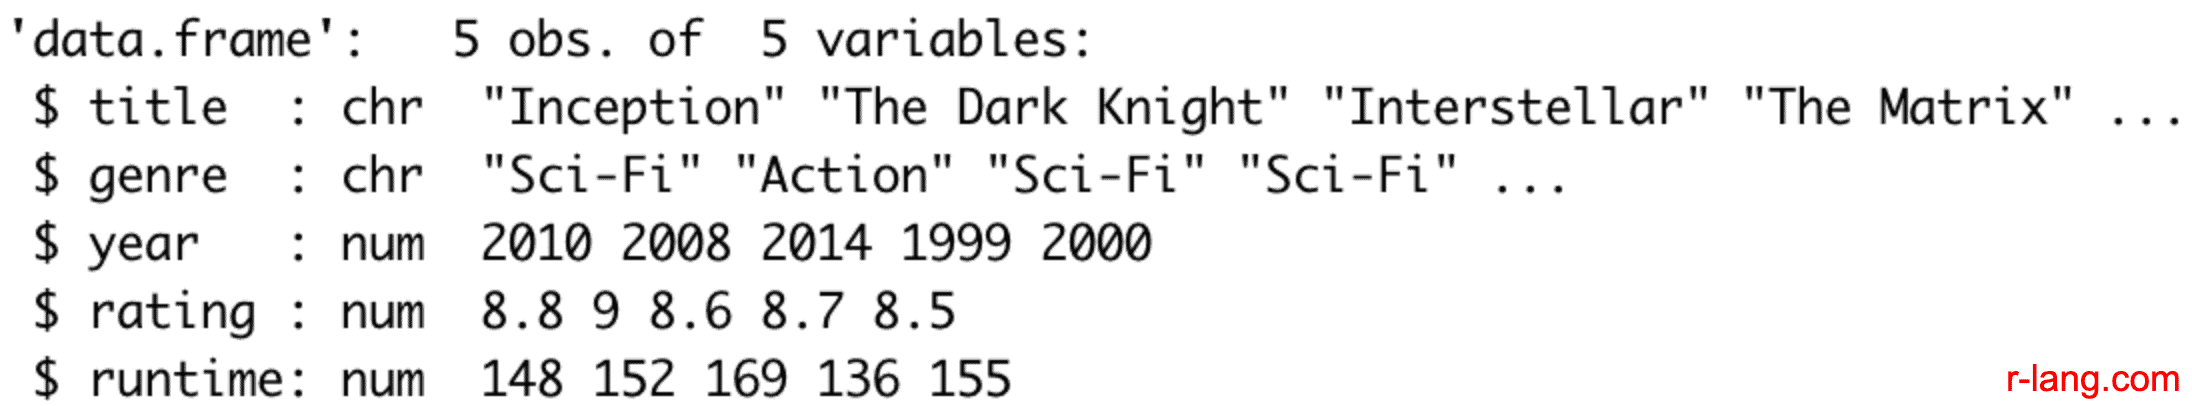
The above screenshot shows that title, genre have character columns, and year, rating, runtime have numeric columns.
Adding a new column to an existing data frame
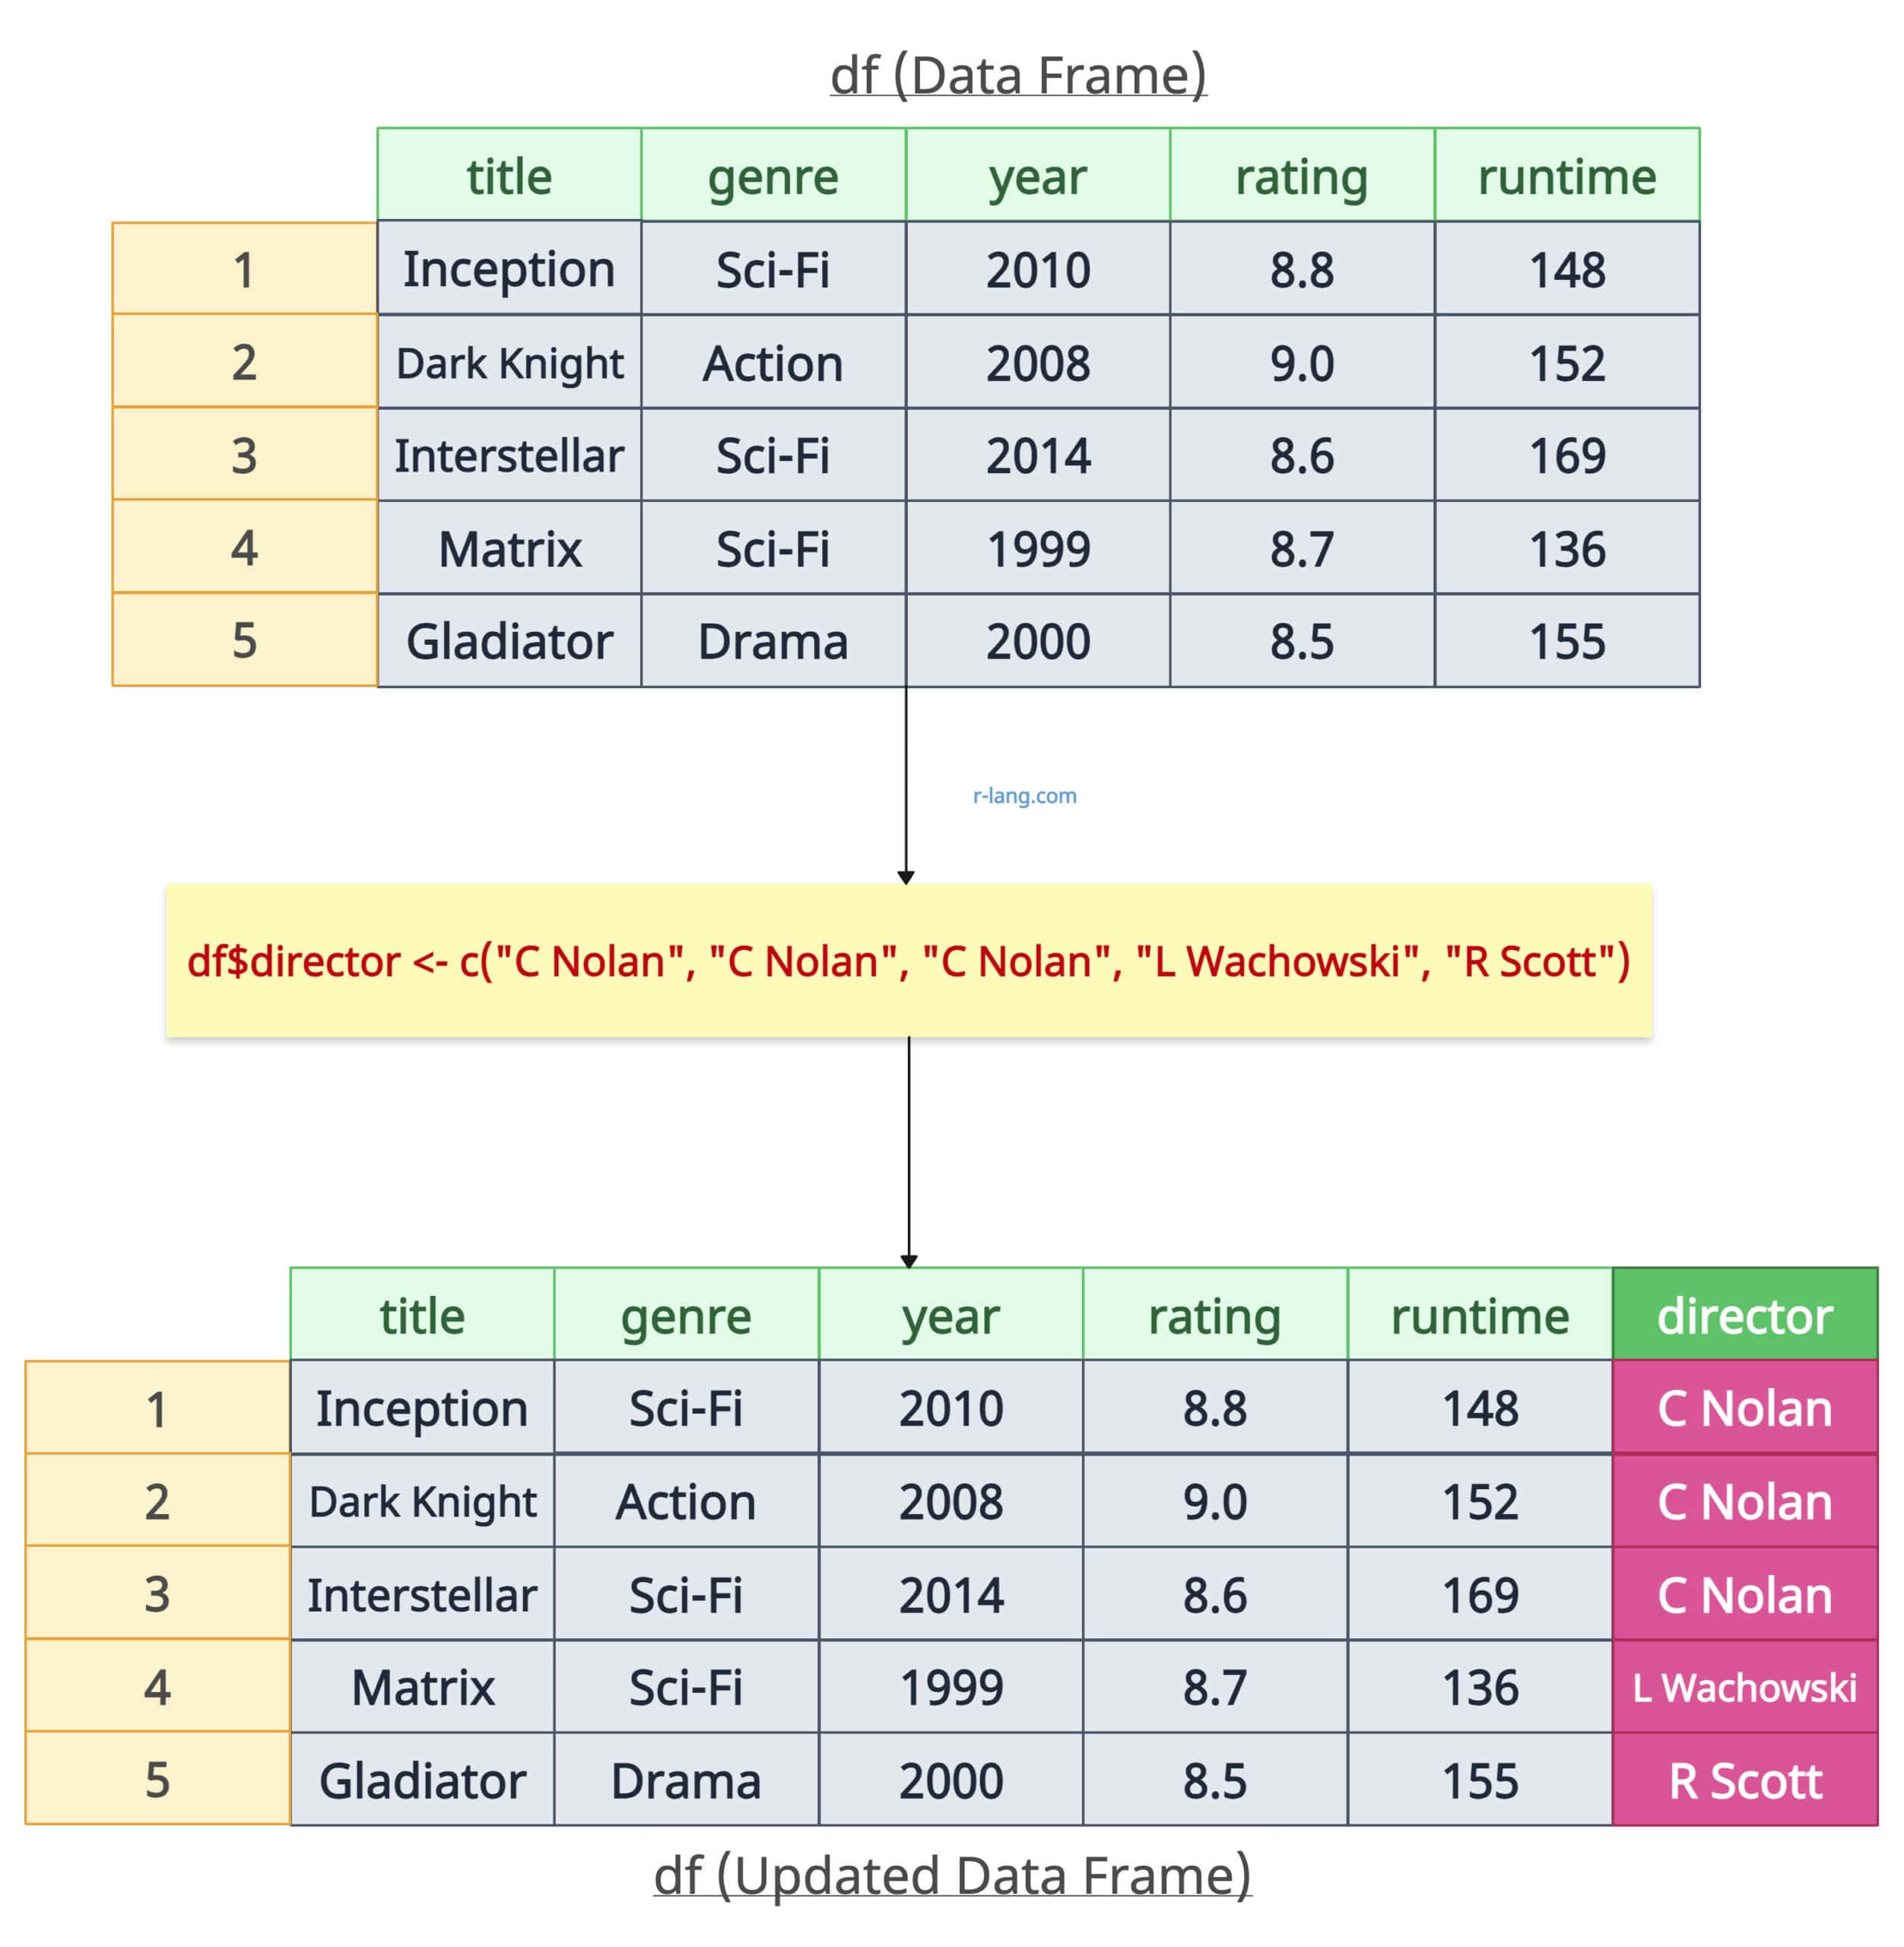
To add a column to an existing data frame, you can use the “$” operator and assign values to the new column.
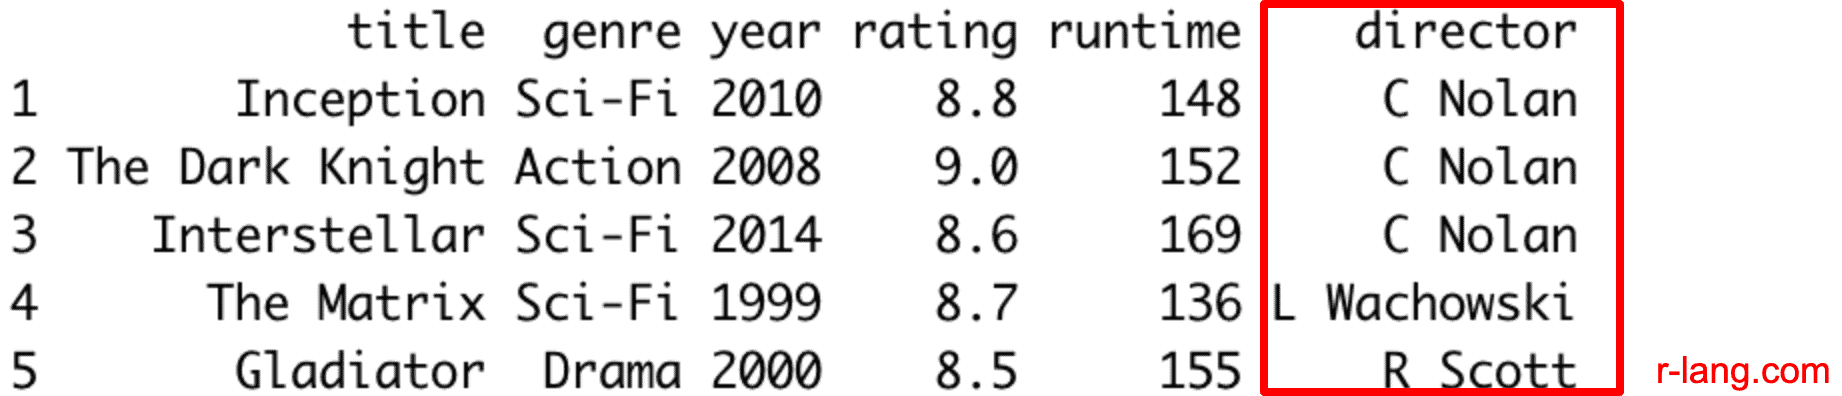
Let’s add the “director” column to our data frame.
title <- c("Inception", "The Dark Knight", "Interstellar", "The Matrix", "Gladiator")
genre <- c("Sci-Fi", "Action", "Sci-Fi", "Sci-Fi", "Drama")
year <- c(2010, 2008, 2014, 1999, 2000)
rating <- c(8.8, 9.0, 8.6, 8.7, 8.5)
runtime <- c(148, 152, 169, 136, 155)


# Create a data frame from vectors
df <- data.frame(title, genre, year, rating, runtime)

# Adding a new column to an existing data Frame
df$director <- c("C Nolan", "C Nolan", "C Nolan", "L Wachowski", "R Scott")
print(df)
Output
Adding a new row to an existing data frame
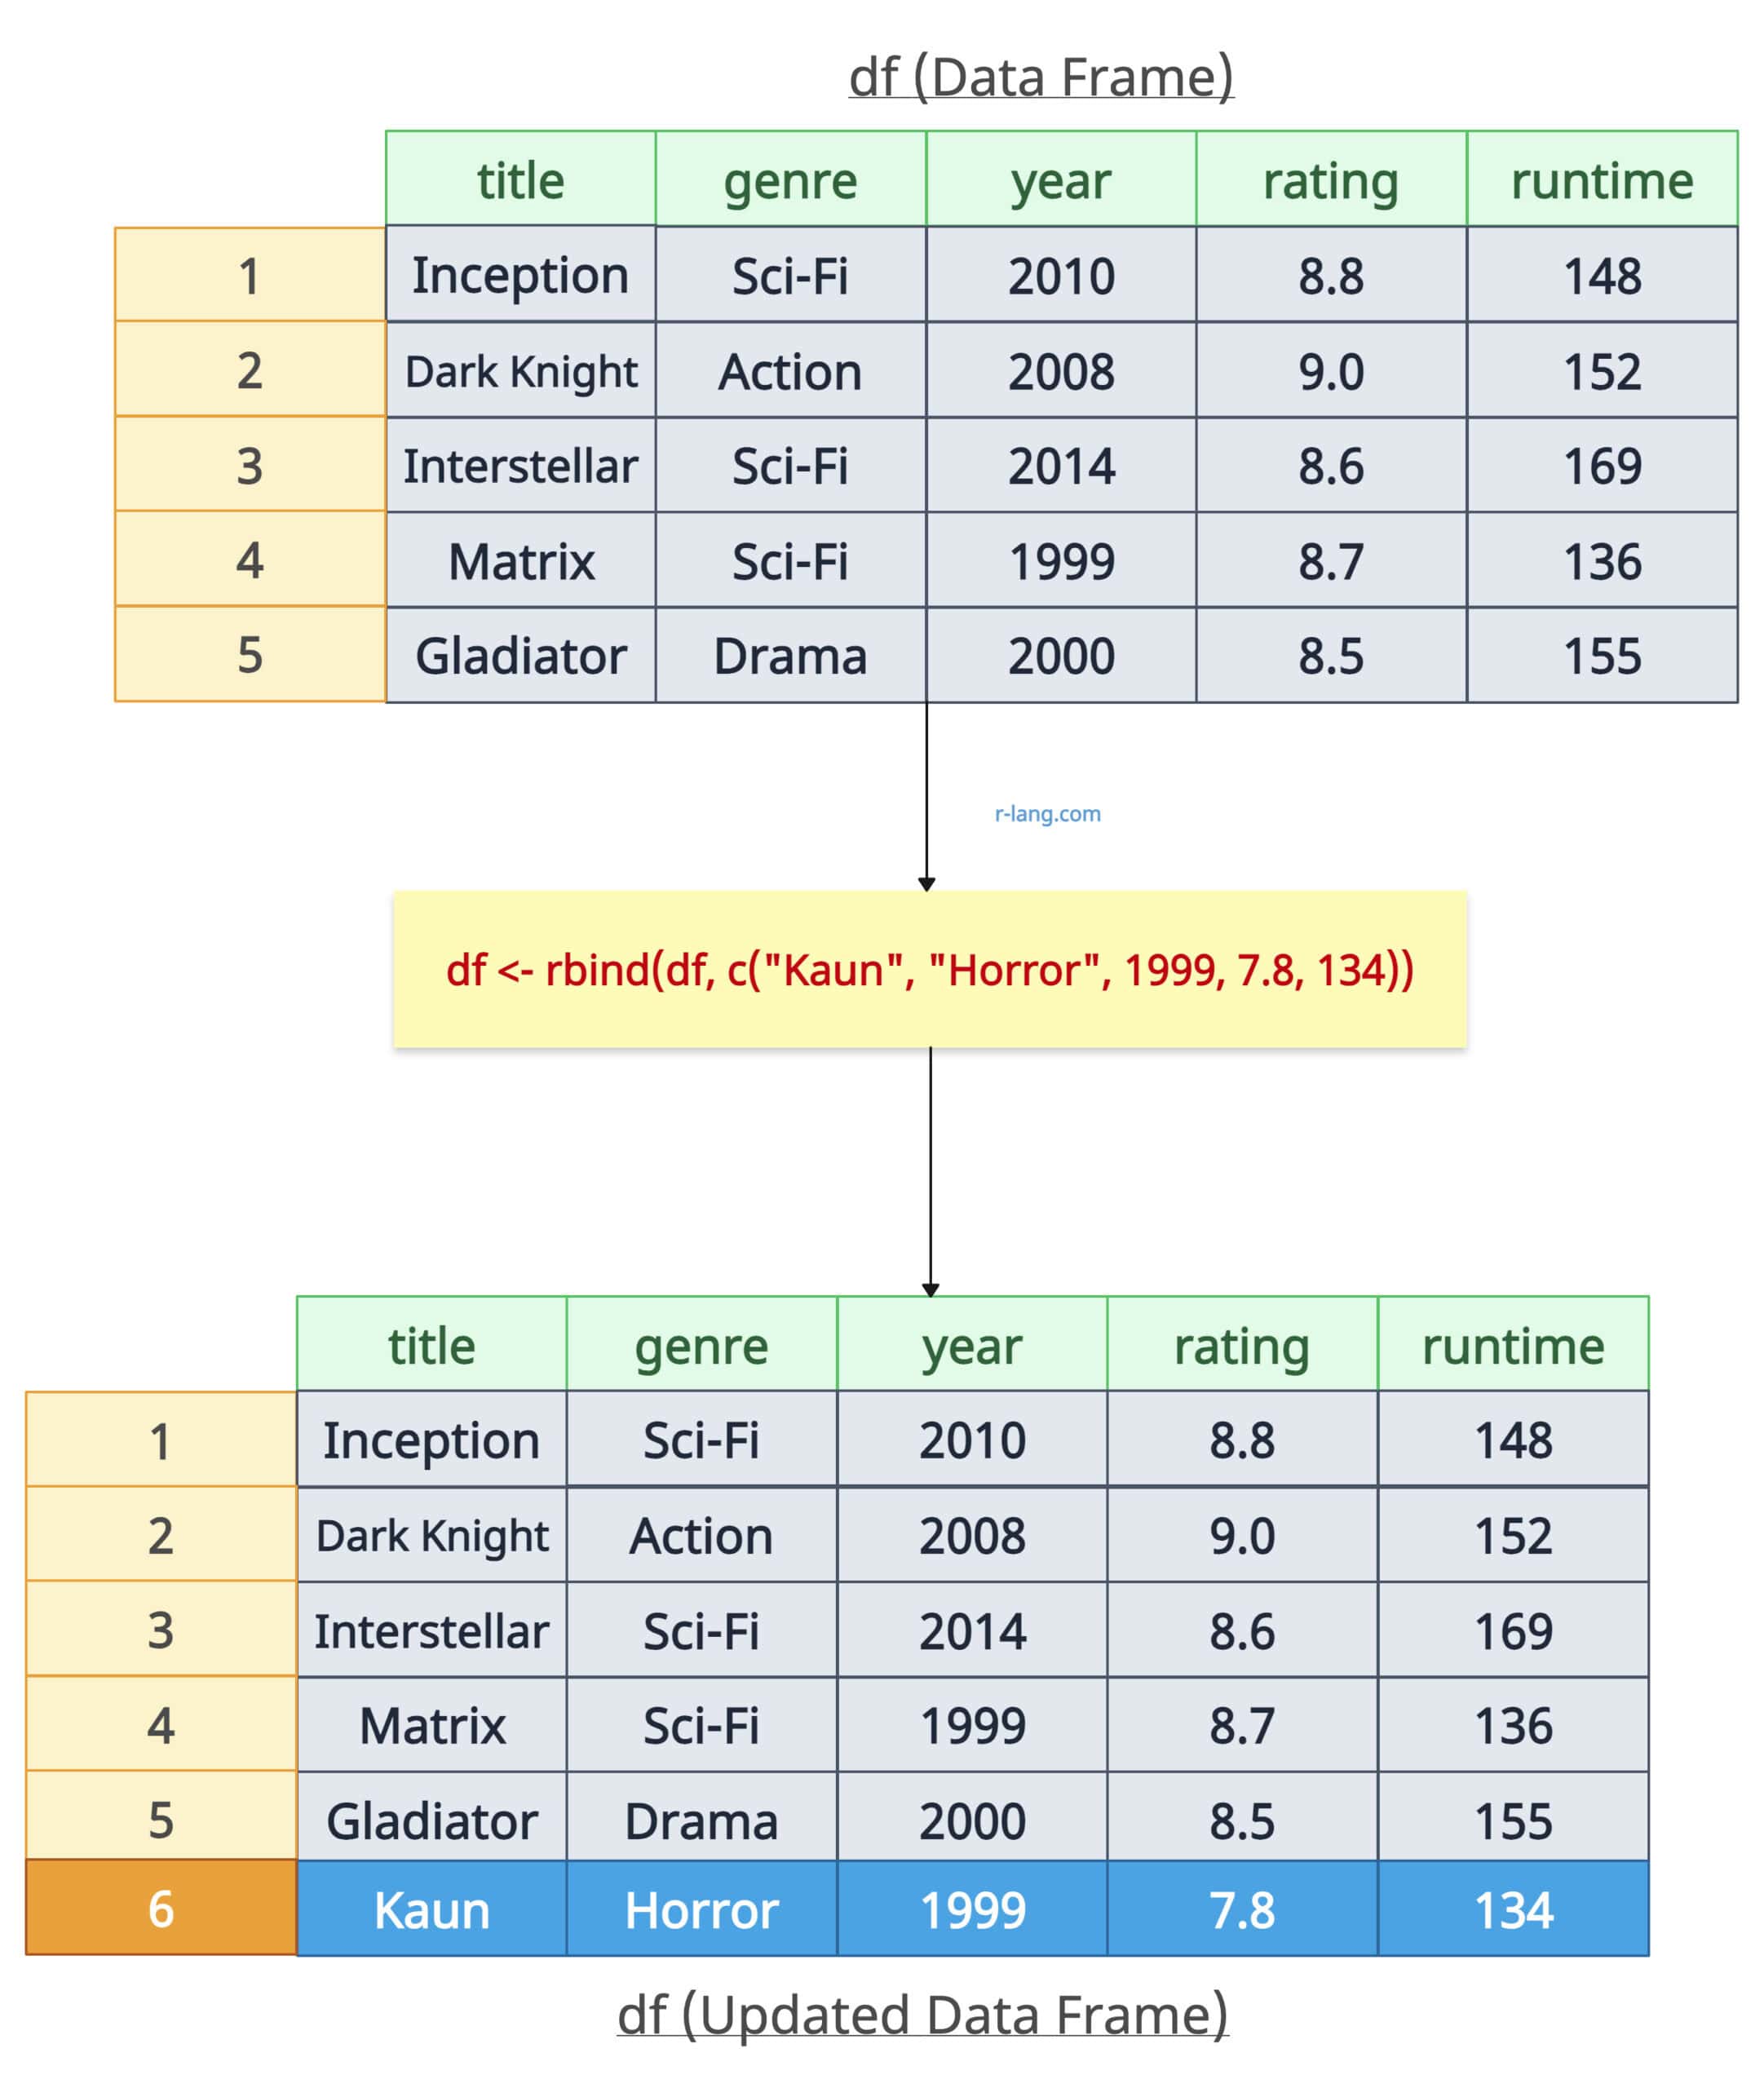
You can add a new row to an existing data frame using the rbind() function. It accepts the first argument as an existing data frame and a vector that will be converted into a new row in the data frame.
title <- c("Inception", "The Dark Knight", "Interstellar", "The Matrix", "Gladiator")
genre <- c("Sci-Fi", "Action", "Sci-Fi", "Sci-Fi", "Drama")
year <- c(2010, 2008, 2014, 1999, 2000)
rating <- c(8.8, 9.0, 8.6, 8.7, 8.5)
runtime <- c(148, 152, 169, 136, 155)

# Create a data frame from vectors
df <- data.frame(title, genre, year, rating, runtime)

# Adding a row to an existing data frame
df <- rbind(df, c("Kaun", "Horror", 1999, 7.8, 134))
print(df)
Output
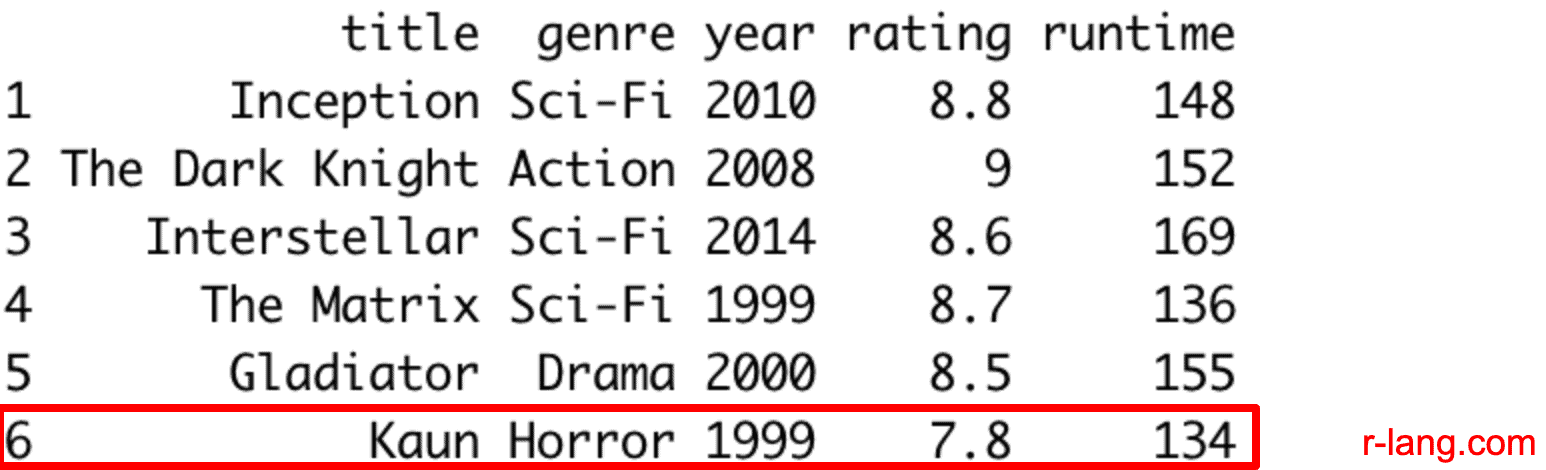
That’s it!

Krunal Lathiya is a seasoned Computer Science expert with over eight years in the tech industry. He boasts deep knowledge in Data Science and Machine Learning. Versed in Python, JavaScript, PHP, R, and Golang. Skilled in frameworks like Angular and React and platforms such as Node.js. His expertise spans both front-end and back-end development. His proficiency in the Python language stands as a testament to his versatility and commitment to the craft.