The lwd in R is used to specify the width of plot lines. It is a parameter that can be set in various plotting functions, such as plot(), lines(), abline(), etc.
Syntax of lwd parameter
plot( x, y, pch = 1, cex = 1, col = 1,
      bg = 0, lwd = 1, lty = 1, type = "p", add = FALSE )
As you can see, one of the arguments is lwd, and its value is 1.
Example
x <- c(1, 2, 3, 4, 5, 6, 7)
y <- c(1, 8, 27, 64, 125, 216, 343)

plot(x, y, pch=23, col = "black", bg = "yellow", lwd=1, cex=1.5)
Output
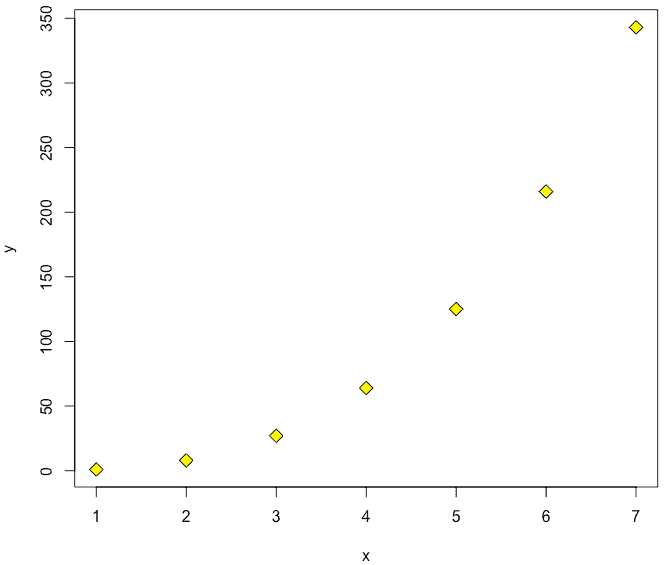
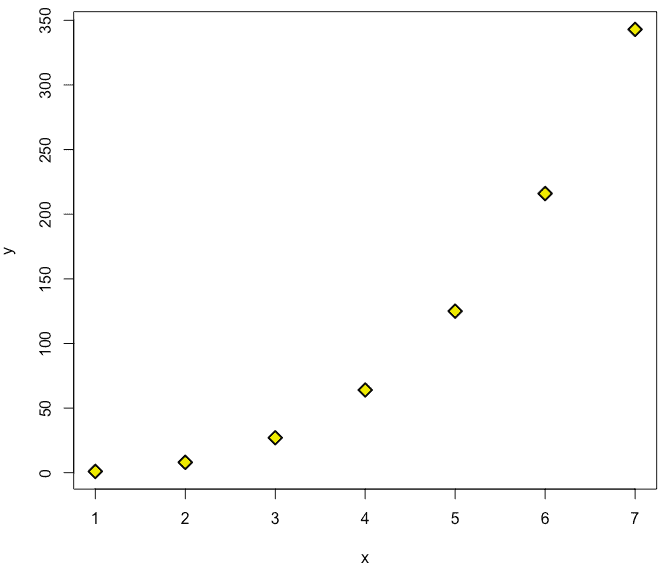
In this plot, we have passed the lwd = 1 value, and you can see that the diamond point’s border has a width of 1. If we change the lwd = 2, the width will increase.
Use the pch option to define the symbols for your plotting points. For example, from symbols 21 through 25, you can define the border color (col=) and fill color (bg=).
Various options can help you specify the color for various plot properties.

Krunal Lathiya is a seasoned Computer Science expert with over eight years in the tech industry. He boasts deep knowledge in Data Science and Machine Learning. Versed in Python, JavaScript, PHP, R, and Golang. Skilled in frameworks like Angular and React and platforms such as Node.js. His expertise spans both front-end and back-end development. His proficiency in the Python language stands as a testament to his versatility and commitment to the craft.