What do you mean by counting unique values by group? Well, it means you divide the dataset into subsets based on the values of one or more categorical variables (columns). Within each subset, you determine the number of distinct (unique) values in a specific column.
Here are three ways to count unique values by group:
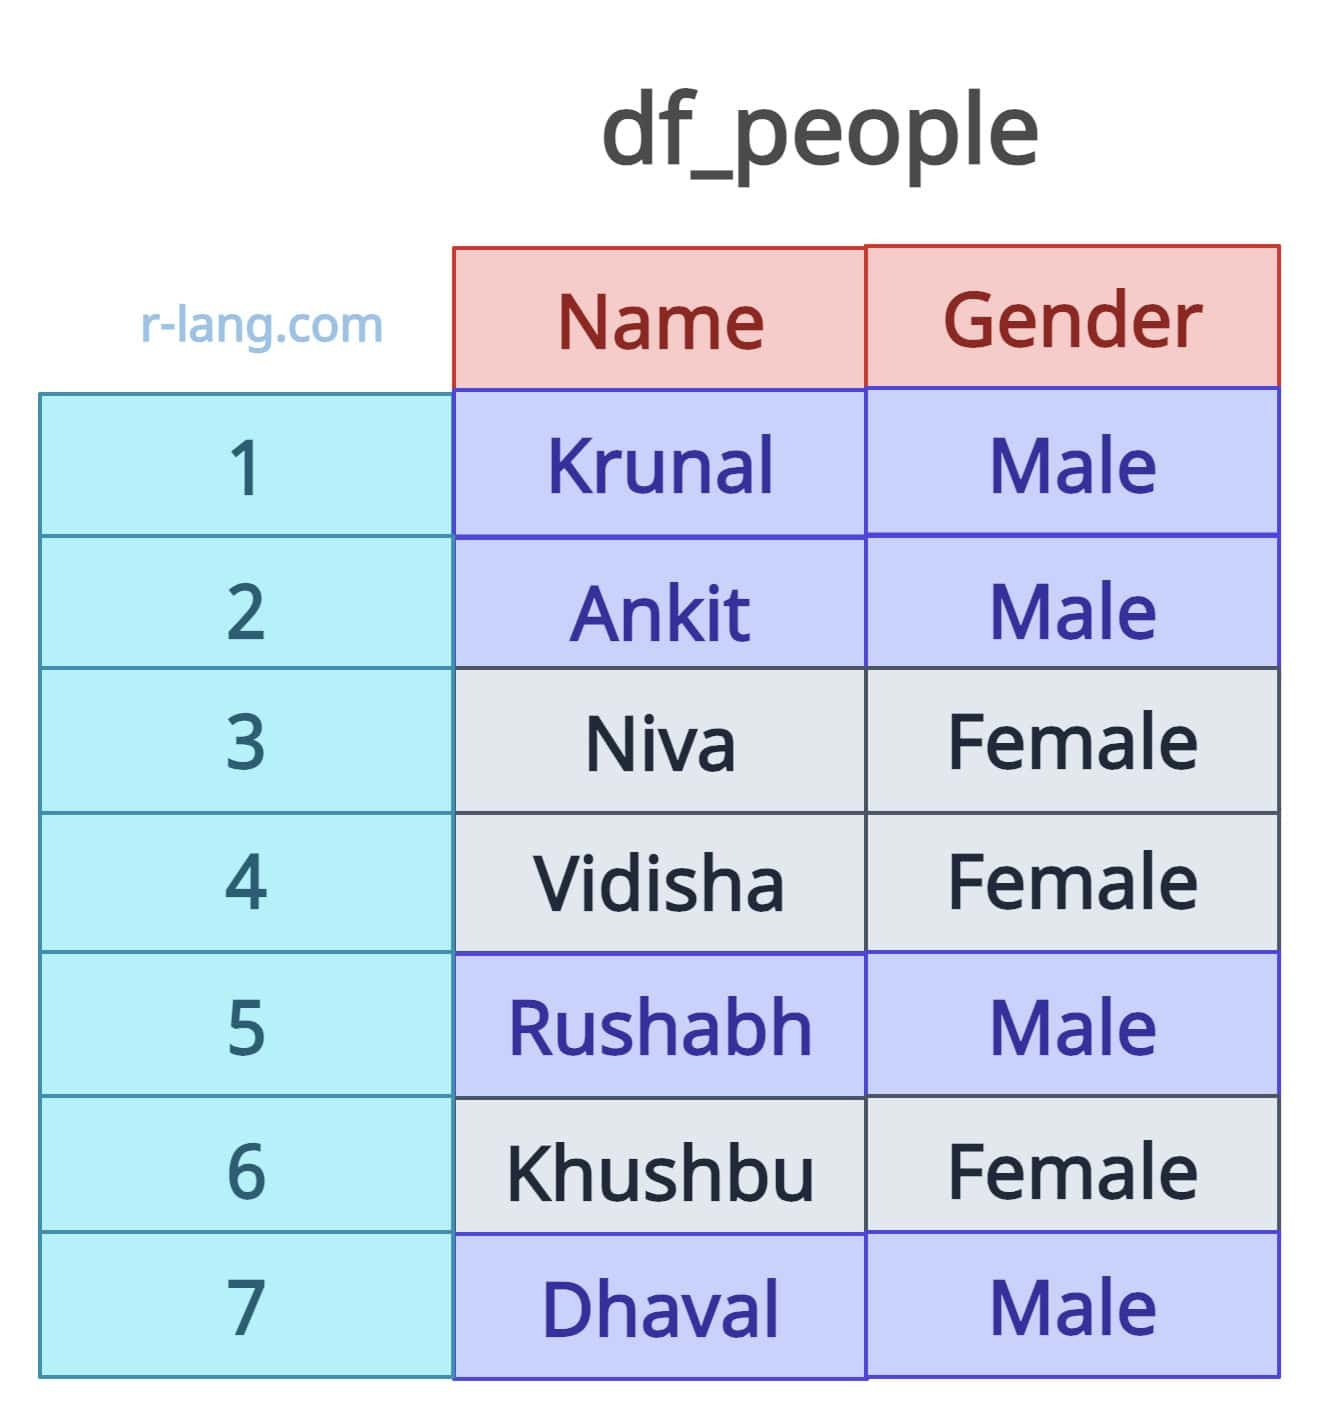
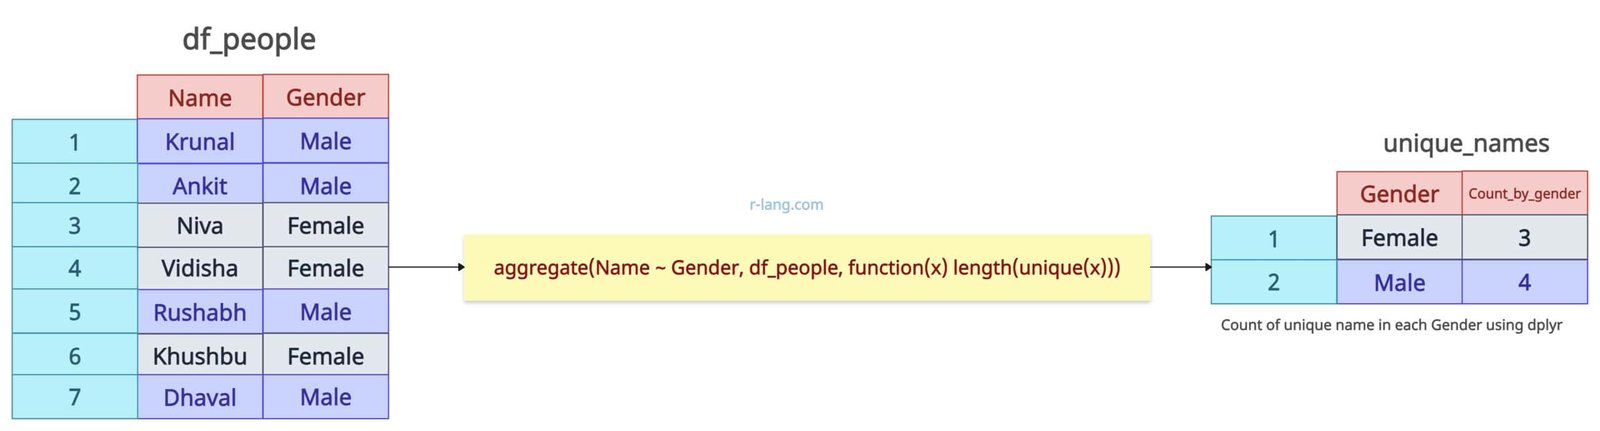
Let’s say we have a sample data frame like image below:
Let’s implement this result using the methods mentioned above.
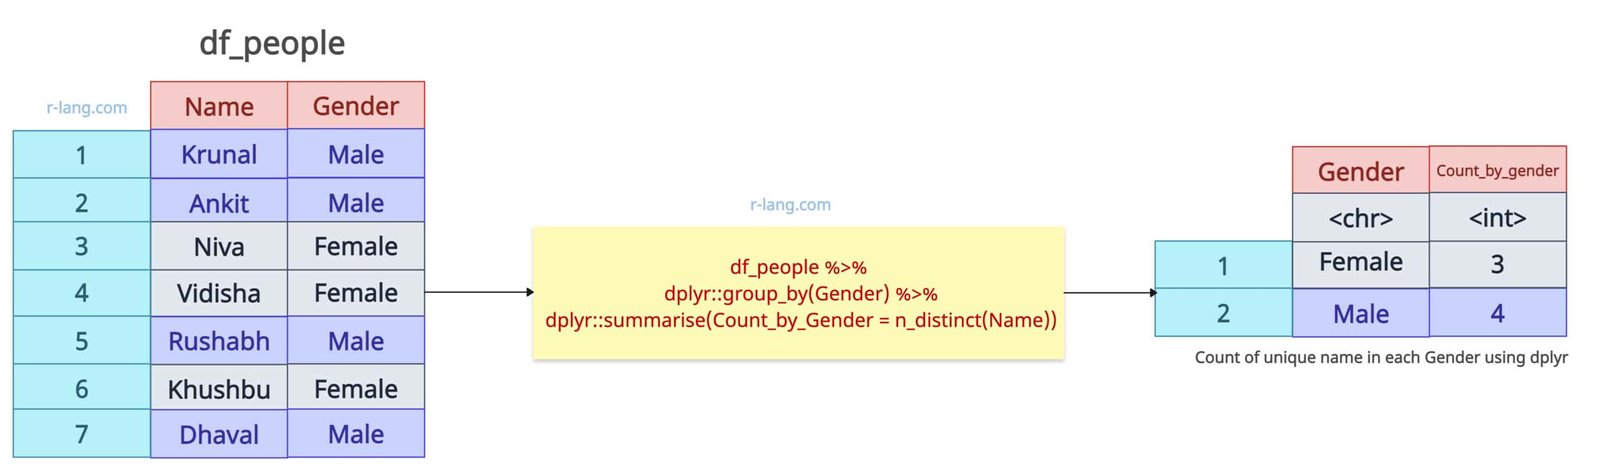
The dplyr::group_by() function divides the data frame based on categorical variables, and then the dplyr::summarise() function, with the help of the n_distinct() method, counts the distinct values in the specific column.
library(dplyr)
df_people <- data.frame(
Name = c("Krunal", "Ankit", "Niva", "Vidisha", "Rushabh", "Khushbu", "Dhaval"),
Gender = c("Male", "Male", "Female", "Female", "Male", "Female", "Male"),
stringsAsFactors = FALSE
)
print(df_people)
# Count of unique people in each Gender using dplyr
df_people %>%
group_by(Gender) %>%
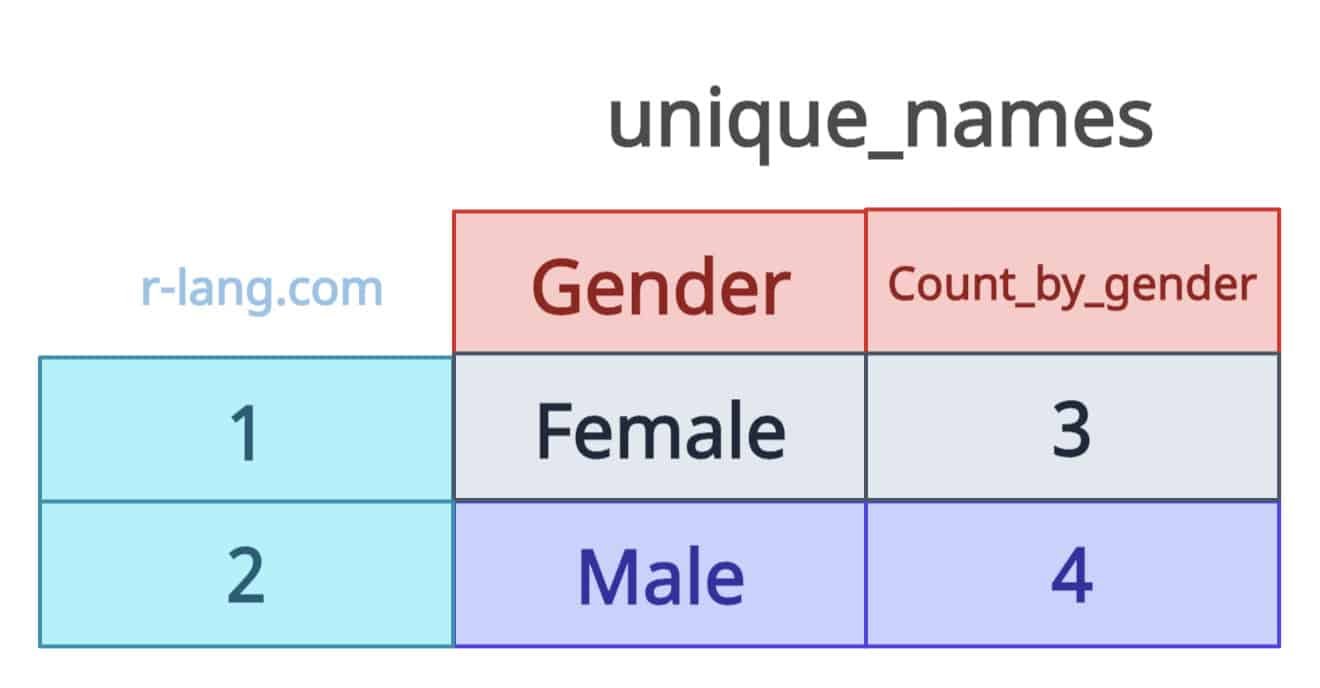
summarise(Count_by_Gender = n_distinct(Name))
Output
R comes with various built-in datasets, and “mtcars” is one of them.
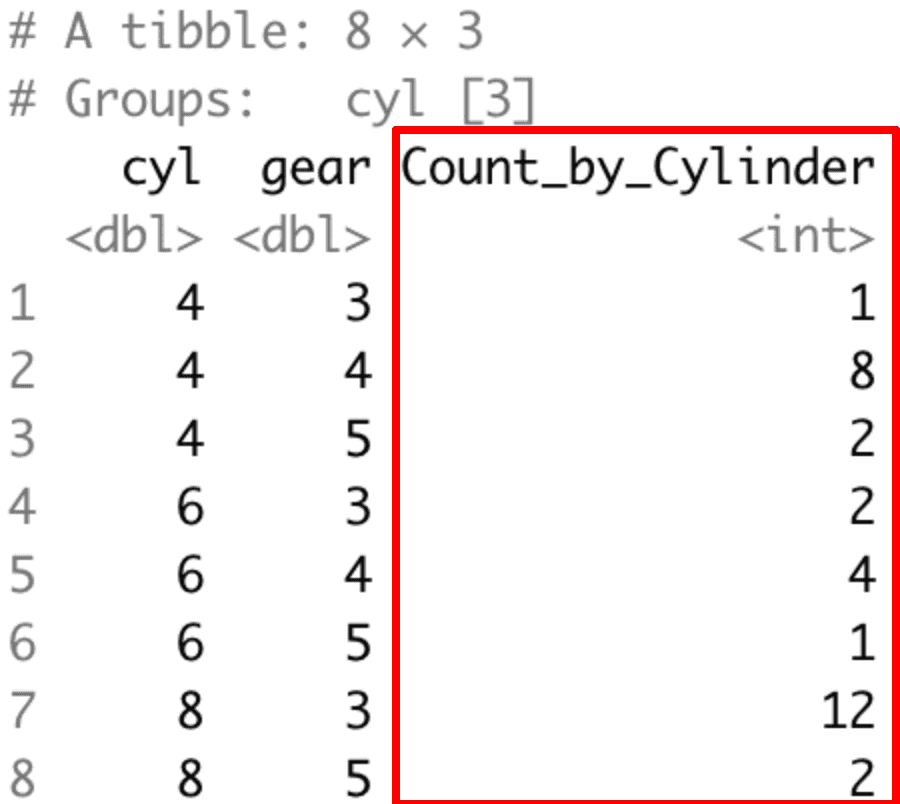
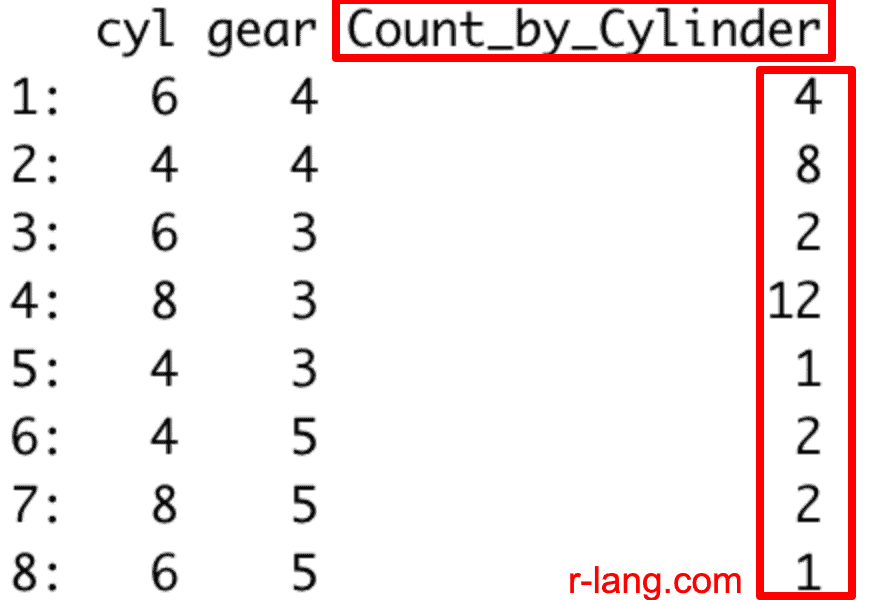
Let’s count the number of cars in each cylinder and gear (multiple groups).
library(dplyr)


# Use built-in dataset mtcars
# Count the number of cars in each cylinder group and gear

mtcars %>%
  group_by(cyl, gear) %>%
  summarise(Count_by_Cylinder = n())
Output
In this code, the n() function counts the number of observations (cars) in each (cyl, gear) group.
The aggregate() function accepts (value_column ~ group_by_column), a data frame, and a function that does the counting, in our case, and returns the subset of unique counts group-wise.
df_people <- data.frame(
  Name = c("Krunal", "Ankit", "Niva", "Vidisha", "Rushabh", "Khushbu", "Dhaval"),
  Gender = c("Male", "Male", "Female", "Female", "Male", "Female", "Male"),
  stringsAsFactors = FALSE
)

print(df_people)


# Count of people in each Gender using aggregate() function

unique_names <- aggregate(Name ~ Gender, df_people, function(x) length(unique(x)))

# Rename the output column for clarity
names(unique_names)[2] <- "Count_by_Gender"

print(unique_names)
Output
After getting the output data frame, we assign a new name to the output data frame called “unique_names” using the names() function.
If you are working with a large dataset, you should use data.table instead of data.frame. Why? Because it uses optimized indexing, avoids unnecessary data duplication, and performs reference-based operations.
You need to install data.table package if you have not, and then load it at the start of the file.
Let’s count the unique number of observations based on the cyl and gear groups of the mtcars data set:
library(data.table)

mtcars_dt <- as.data.table(mtcars)

mtcars_dt[, .(Count_by_Cylinder = .N), by = .(cyl, gear)]
Output
That’s all!
Krunal Lathiya is a seasoned Computer Science expert with over eight years in the tech industry. He boasts deep knowledge in Data Science and Machine Learning. Versed in Python, JavaScript, PHP, R, and Golang. Skilled in frameworks like Angular and React and platforms such as Node.js. His expertise spans both front-end and back-end development. His proficiency in the Python language stands as a testament to his versatility and commitment to the craft.
The scale() function in R centers (subtracting the mean) and/or scales (dividing by the standard…
To rename a file in R, you can use the file.rename() function. It renames a…
The prop.table() function in R calculates the proportion or relative frequency of values in a…
The exp() is a built-in function that calculates the exponential of its input, raising Euler's…
The split() function divides the input data into groups based on some criteria, typically specified…
The colMeans() function in R calculates the arithmetic mean of columns in a numeric matrix,…