The View() is a utility function in R that invokes a more intuitive spreadsheet-style data viewer on a matrix-like R object.
View() does not print output in the console or return a value — it is a side-effect function that launches a separate data viewer window. It is ideal for quickly checking data contents, identifying patterns, or verifying data integrity during data analysis workflows.
View(x, title)Ensure you type a capital “V” when using this function.
| Argument | Description |
| x | It represents an R object coerced to a data frame with non-zero numbers of rows and columns. |
| title | It is an optional character string specifying the title of the viewer window—defaults to “Data:” followed by the name of x. |
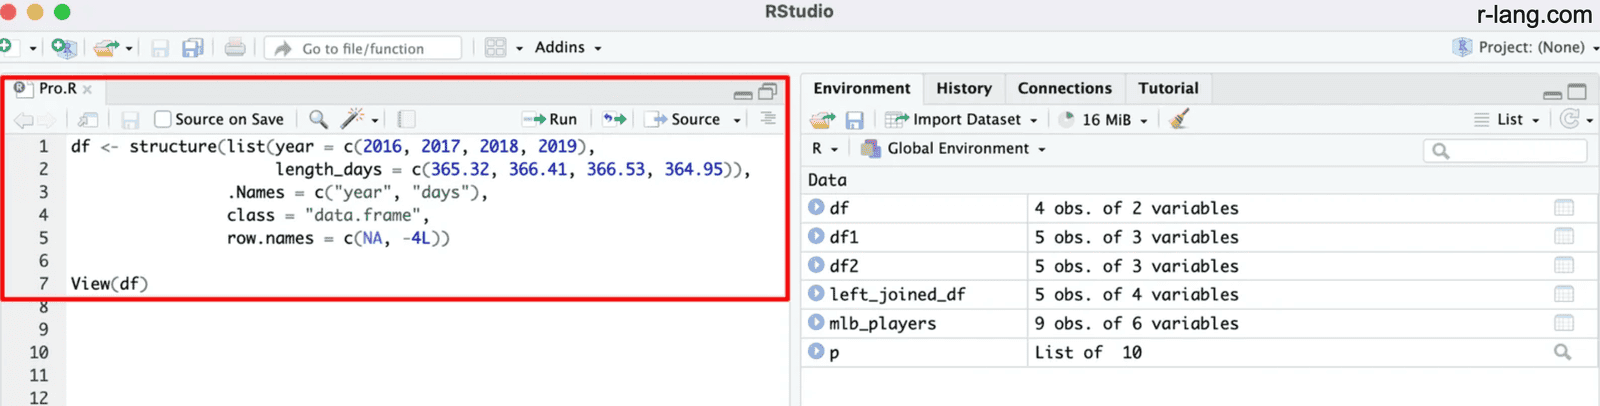
Open RStudio. Create an R file and add the following code.
df <- structure(list(year = c(2016, 2017, 2018, 2019),
                    length_days = c(365.32, 366.41, 366.53, 364.95)),
 .Names = c("year", "days"),
 class = "data.frame",
 row.names = c(NA, -4L))

View(df)
In this example, we create a data frame using the structure() function.
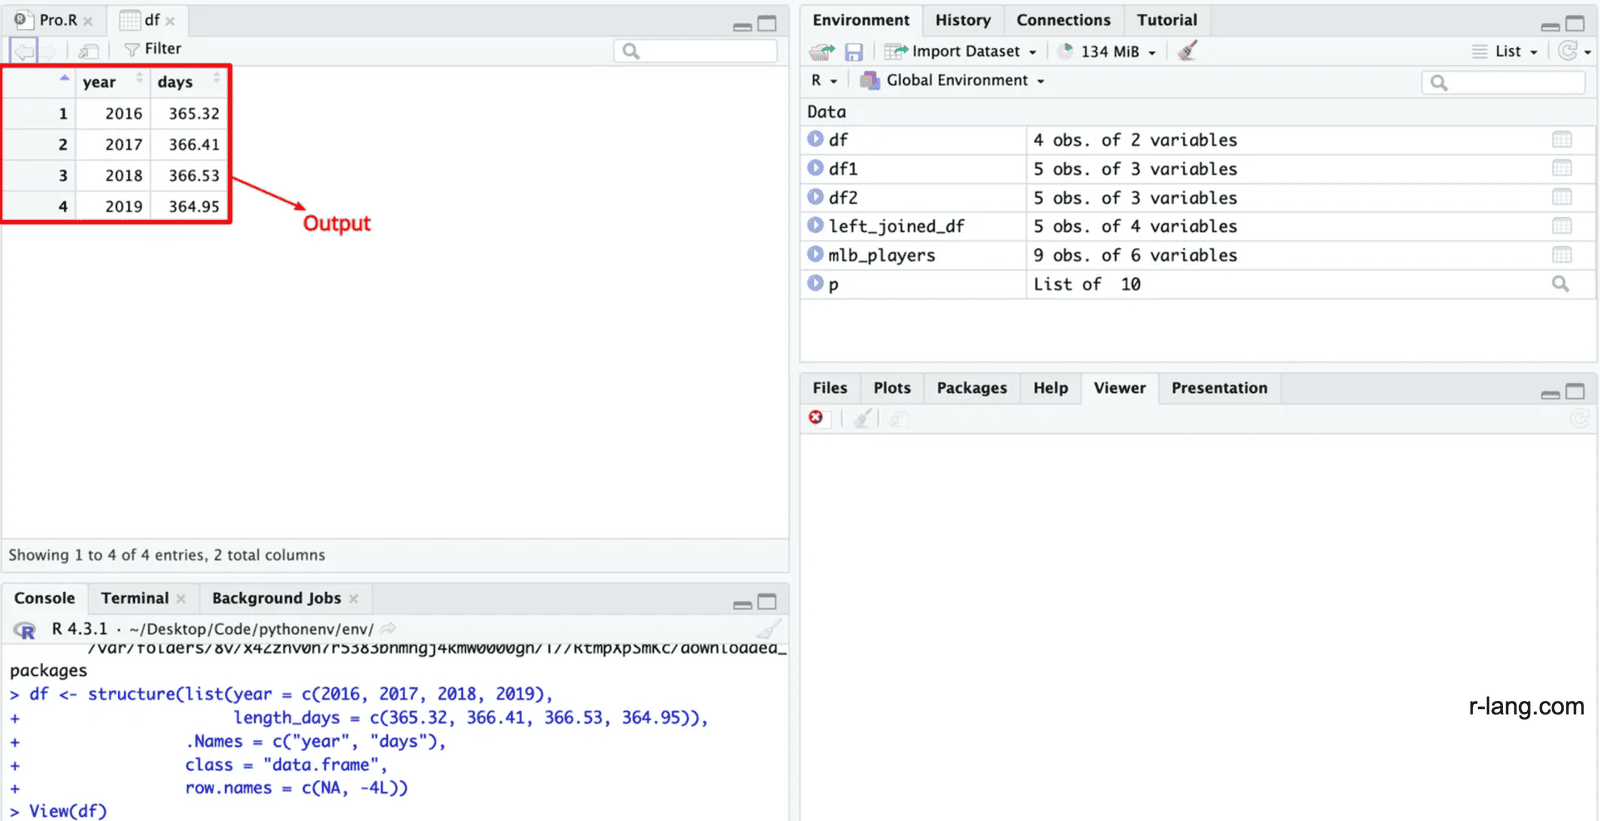
To see the output, run the above code inside RStudio, and it will give you the following output.
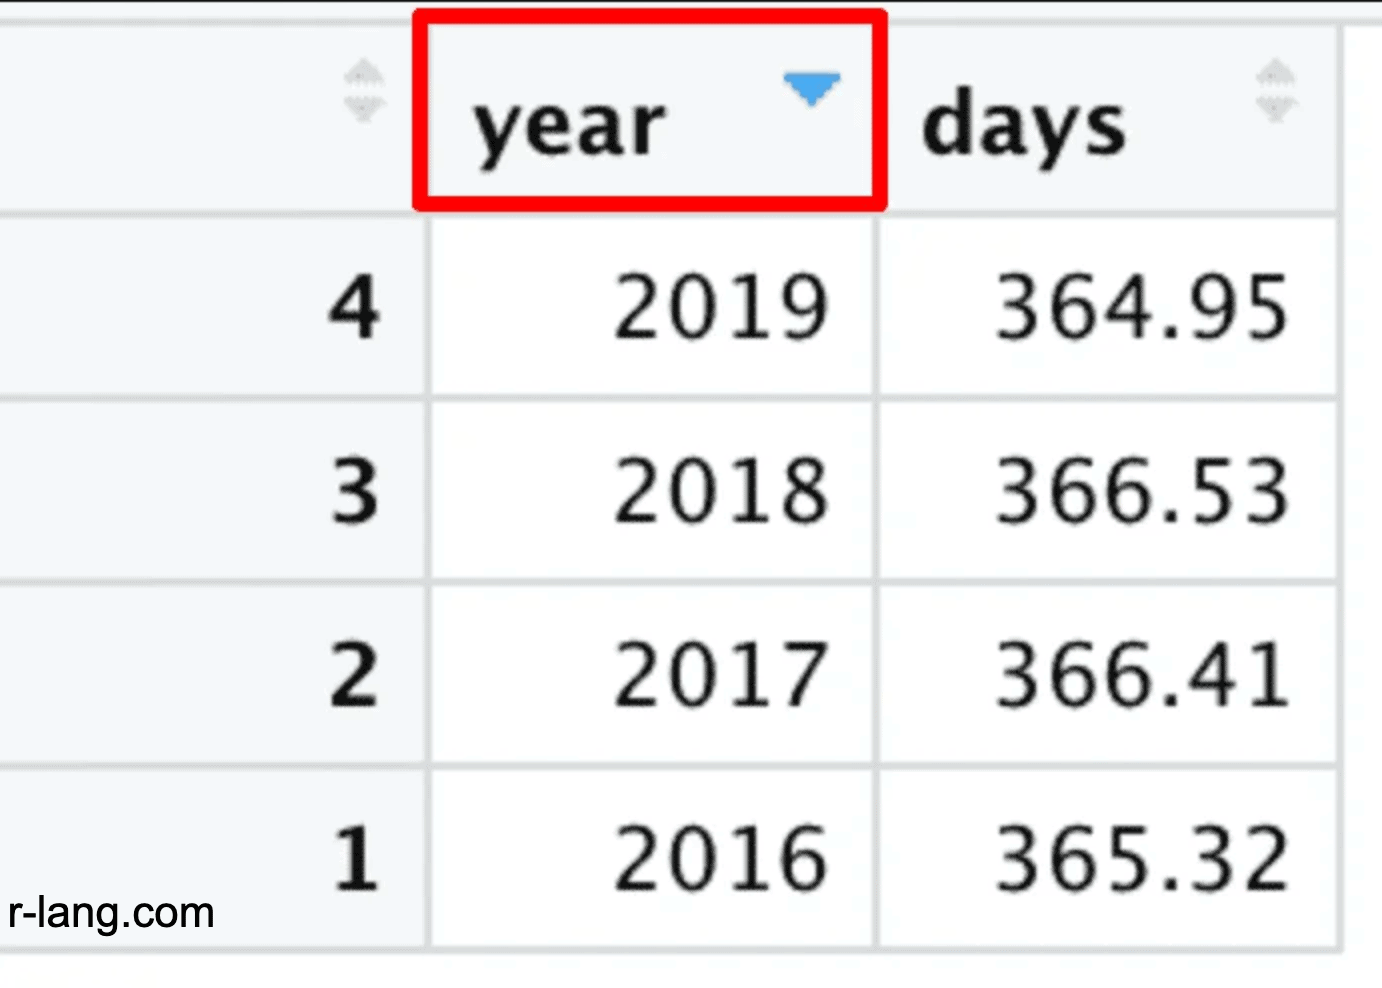
You can sort the data frame by clicking on one of the columns.
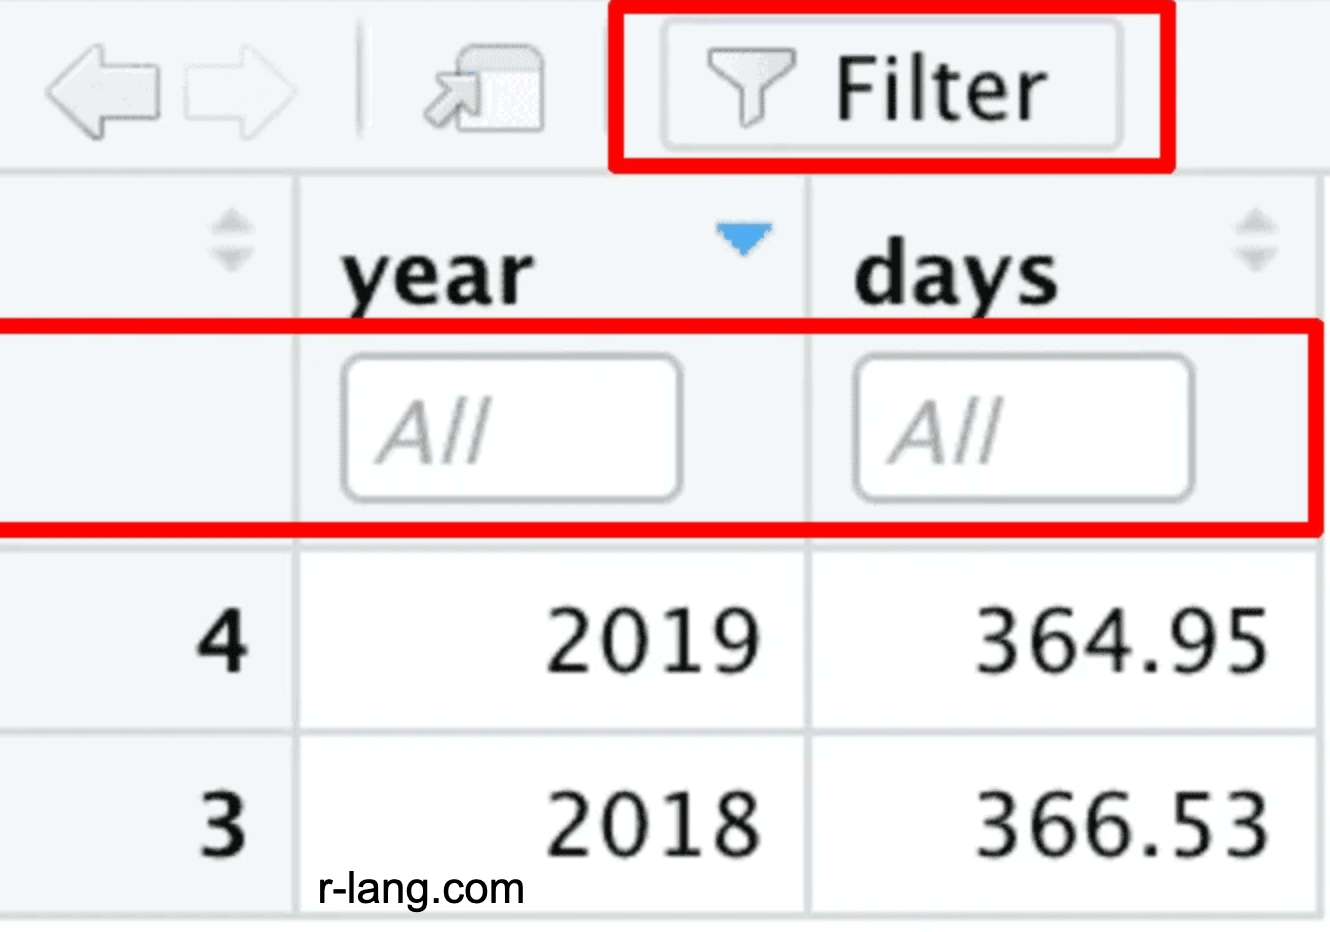
You can filter the data frame by clicking the Filter icon, selecting a column name, and then entering a range of values.
That’s it.
Krunal Lathiya is a seasoned Computer Science expert with over eight years in the tech industry. He boasts deep knowledge in Data Science and Machine Learning. Versed in Python, JavaScript, PHP, R, and Golang. Skilled in frameworks like Angular and React and platforms such as Node.js. His expertise spans both front-end and back-end development. His proficiency in the Python language stands as a testament to his versatility and commitment to the craft.
The scale() function in R centers (subtracting the mean) and/or scales (dividing by the standard…
To rename a file in R, you can use the file.rename() function. It renames a…
The prop.table() function in R calculates the proportion or relative frequency of values in a…
The exp() is a built-in function that calculates the exponential of its input, raising Euler's…
The split() function divides the input data into groups based on some criteria, typically specified…
The colMeans() function in R calculates the arithmetic mean of columns in a numeric matrix,…