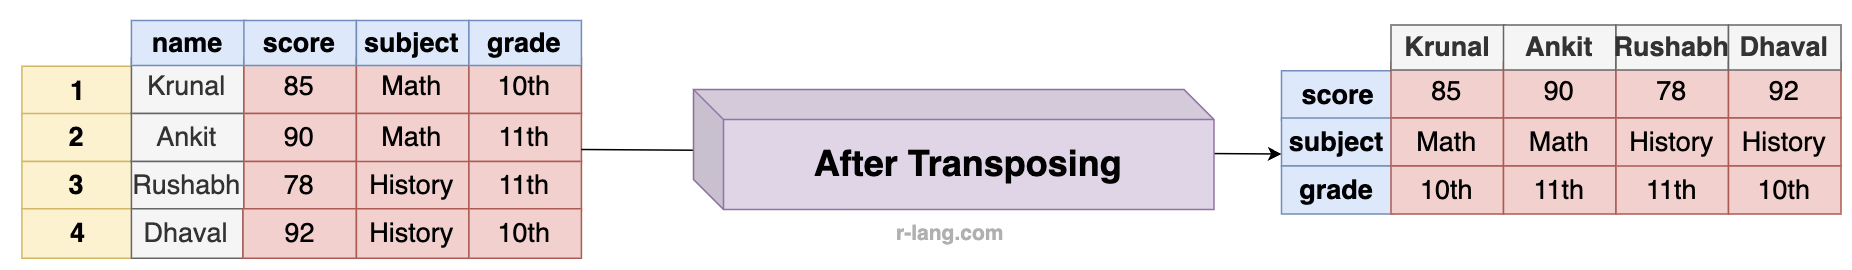
Transposing means switching rows to columns and columns to rows. It is a common operation in the matrix.
The above figure shows that column names from the original data frame have become row names, and the first column values of the original data frame have become column names. Everything has been switched.
Here are two main ways to transpose a data frame in R:
The t() function is primarily used for matrices, but it can also be applied to a data frame. The t() method first converts the data frame into a matrix, which may coerce all data to a single type (e.g., character), and then converts it back to the data frame.
While transposing, you need to keep in mind the following things:
Here is a code example:
df <- data.frame(
name = c("Millie", "Yogita", "KMJ"),
score = c(90, 95, 77),
subject = c("Biology", "Biology", "Biology"),
grade = c(12, 12, 11),
stringsAsFactors = FALSE # Prevents automatic factor conversion
)
print("Before transposing:")
print(df)
# Transpose and convert to data frame
df_transposed <- as.data.frame(t(df), stringsAsFactors = FALSE)
# Set column names using the first row
colnames(df_transposed) <- df_transposed[1, ]
df_transposed <- df_transposed[-1, ]
# Automatically convert numeric columns while keeping text columns unchanged
df_transposed <- type.convert(df_transposed, as.is = TRUE)
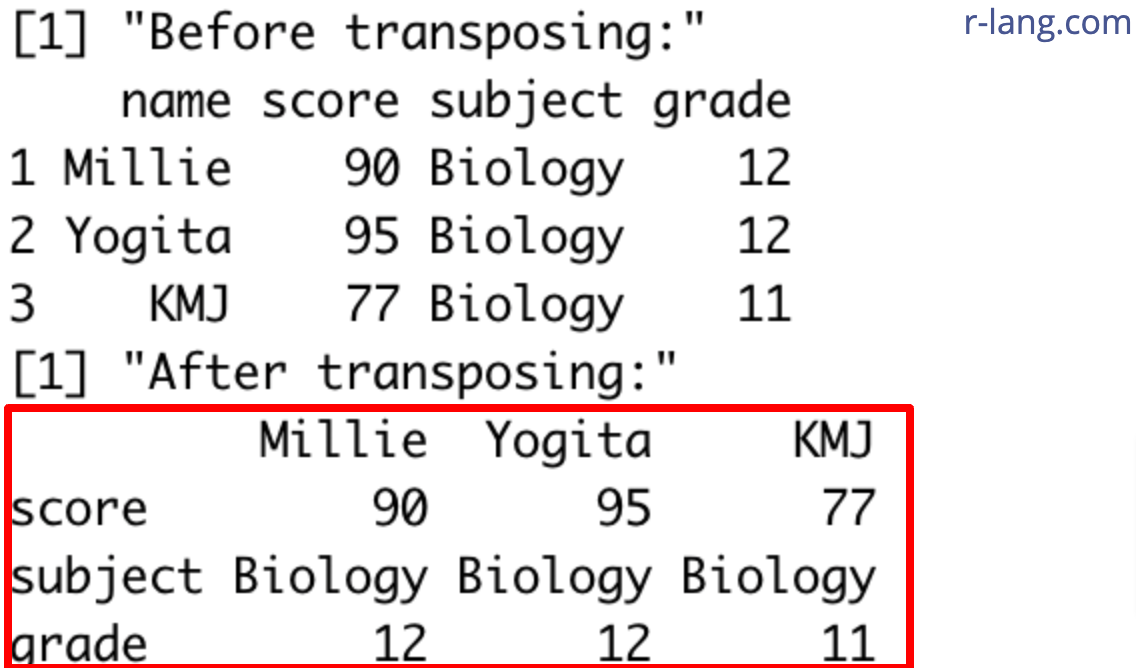
print("After transposing:")
print(df_transposed)
Output
If you compare the output with the original data frame, it remains sensible, and you can analyze it as needed. This approach is helpful when working with a small dataset, but it becomes slow as the dataset grows larger.
The data.table package provides a more efficient transpose() function that handles names and types more flexibly.
Here are the steps to follow:
However, you need to install the data.table() package first, and then load it. Check out the complete code.
library(data.table)
# Source data frame
df <- data.frame(
name = c("Millie", "Yogita", "KMJ"),
score = c(90, 95, 77),
subject = c("Biology", "Biology", "Biology"),
grade = c(12, 12, 11),
stringsAsFactors = FALSE
)
print("Before transposing:")
print(df)
# Converting to data.table and transpose
df_transposed <- as.data.table(transpose(df))
# Set column names using the first row
setnames(df_transposed, as.character(df_transposed[1, ]))
df_transposed <- df_transposed[-1, ] # Remove first row after setting column names
# Convert numeric columns back to proper types
df_transposed <- df_transposed[, lapply(.SD, type.convert, as.is = TRUE)]
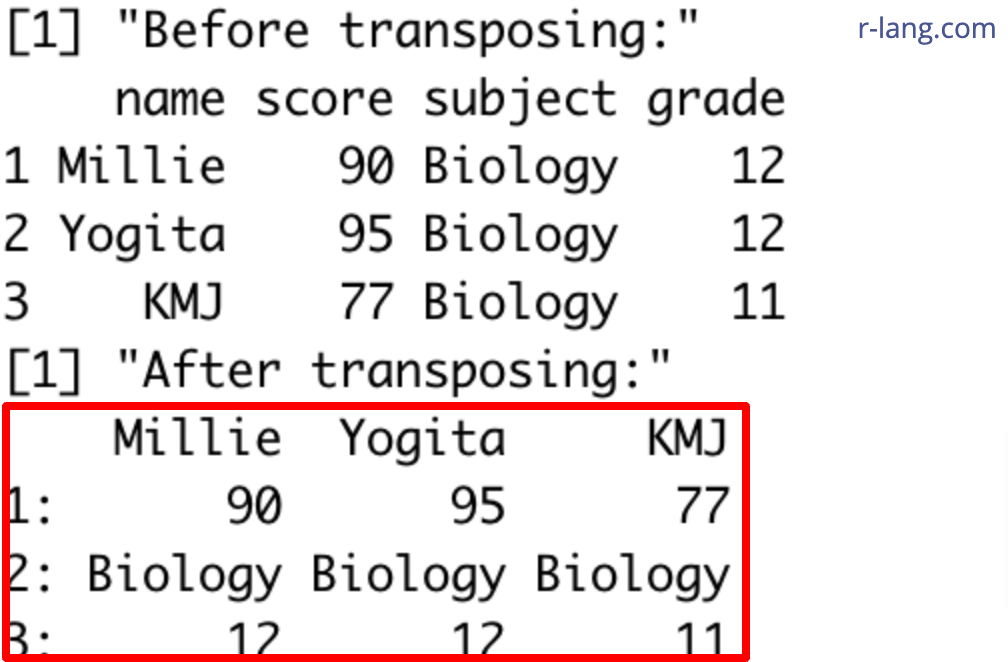
print("After transposing:")
print(df_transposed)Output
The data.table::transpose() function is beneficial for large datasets because it is optimized for performance.
That’s all!
Krunal Lathiya is a seasoned Computer Science expert with over eight years in the tech industry. He boasts deep knowledge in Data Science and Machine Learning. Versed in Python, JavaScript, PHP, R, and Golang. Skilled in frameworks like Angular and React and platforms such as Node.js. His expertise spans both front-end and back-end development. His proficiency in the Python language stands as a testament to his versatility and commitment to the craft.
The scale() function in R centers (subtracting the mean) and/or scales (dividing by the standard…
To rename a file in R, you can use the file.rename() function. It renames a…
The prop.table() function in R calculates the proportion or relative frequency of values in a…
The exp() is a built-in function that calculates the exponential of its input, raising Euler's…
The split() function divides the input data into groups based on some criteria, typically specified…
The colMeans() function in R calculates the arithmetic mean of columns in a numeric matrix,…