
When we say summarise multiple columns, it means aggregate the input data by applying summary functions (sum, mean, max, etc.) to multiple numeric columns simultaneously.
The below image describes visually:
 If grouping is required, you can group by a specific categorical column and get the statistics for each group.
The dplyr package provides the summarise() function that you can use to summarise multiple columns with or without groups. If you don’t use the group_by() function, it will calculate the results across the rows.
Here is the employee data frame we will use to create a summary for multiple columns:
library(dplyr)

employee_data <- data.frame(
  Employee_ID = c("E001", "E002", "E003", "E004", "E005", "E006", "E007"),
  Department = c("HR", "IT", "Finance", "HR", "IT", "HR", "Finance"),
  Salary = c(60000, 80000, 75000, 70000, 85000, 62000, 77000),
  Bonus = c(5000, 8000, 7500, 6000, 9000, 5500, 7000)
)

print(employee_data)

Summarize the entire data frame (without grouping)
Let’s calculate the mean of the salaries and the sum of bonuses for the entire dataset:
library(dplyr)

employee_data <- data.frame(
  Employee_ID = c("E001", "E002", "E003", "E004", "E005", "E006", "E007"),
  Department = c("HR", "IT", "Finance", "HR", "IT", "HR", "Finance"),
  Salary = c(60000, 80000, 75000, 70000, 85000, 62000, 77000),
  Bonus = c(5000, 8000, 7500, 6000, 9000, 5500, 7000)
)

print(employee_data)

# Summarizing Without Grouping (Entire Dataset)
# With multiple summary functions (mean and sum)

employee_data %>%
  summarise(
    Avg_Salary = mean(Salary),
    Sum_Bonus = sum(Bonus)
  )

The above output figure shows the average of the Salary column and the sum of the Bonus column.
We summarised two different columns with two different summary functions (mean and sum).
Summarizing by group using group_by()
Let’s summarize the Salary and Bonus columns grouped by the Department variable.
library(dplyr)

employee_data <- data.frame(
  Employee_ID = c("E001", "E002", "E003", "E004", "E005", "E006", "E007"),
  Department = c("HR", "IT", "Finance", "HR", "IT", "HR", "Finance"),
  Salary = c(60000, 80000, 75000, 70000, 85000, 62000, 77000),
  Bonus = c(5000, 8000, 7500, 6000, 9000, 5500, 7000)
)

print(employee_data)

# Summarizing by Group (Using group_by())
employee_data %>%
  group_by(Department) %>%
  summarize(
    mean_salary = mean(Salary),
    total_bonus = sum(Bonus),
    median_salary = median(Salary),
    sd_salary = sd(Salary),
    count = n() # Count of employees in each department
  )
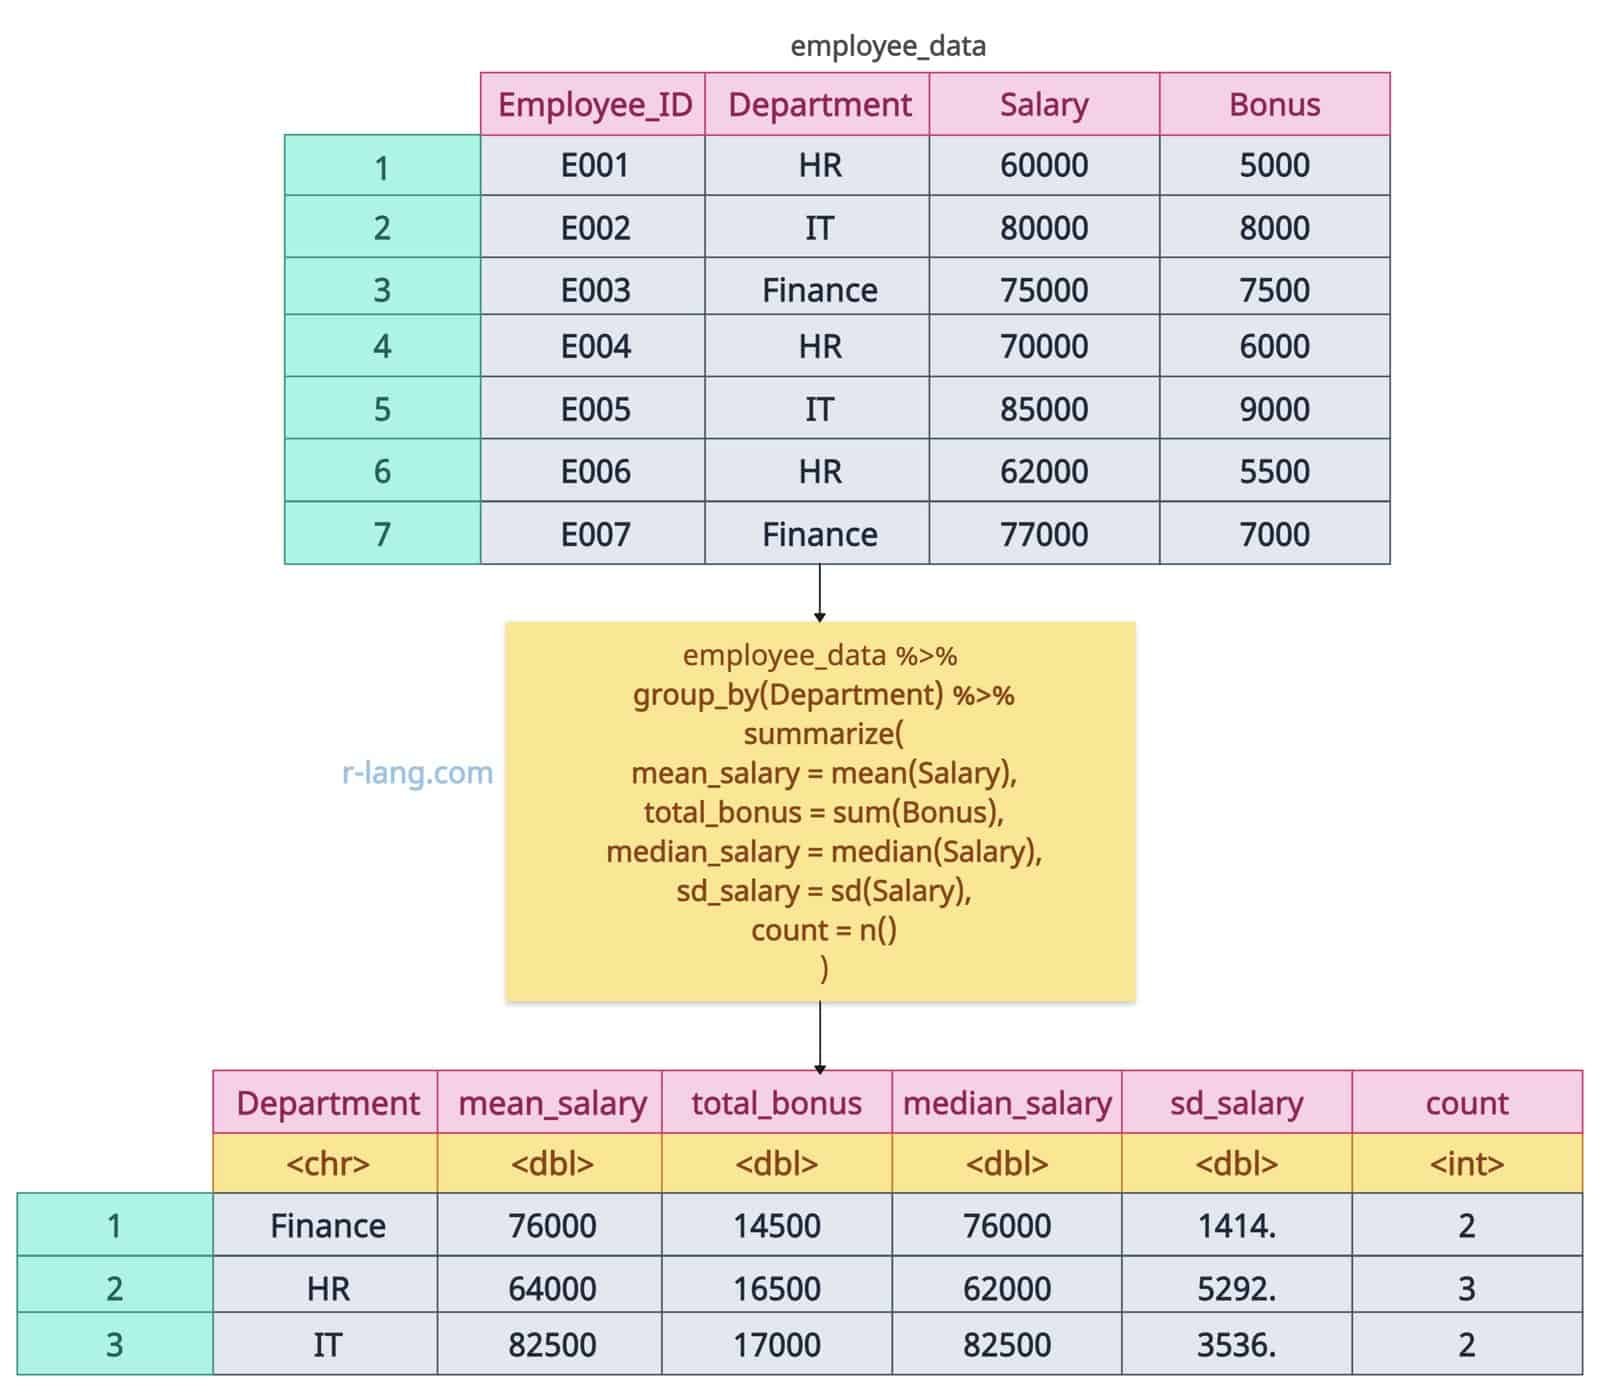
The above figure demonstrates that we calculated the mean, median, and standard deviation of the Salary column and the sum of bonuses grouped by department. At last, counted the number of employees per department.
Using across() to summarise multiple numeric columns
The across() is a modern dplyr function that applies multiple functions to multiple columns. You can choose any of the summary functions like mean(), median(), quantile(), etc., for numeric columns.
library(dplyr)

employee_data <- data.frame(
  Employee_ID = c("E001", "E002", "E003", "E004", "E005", "E006", "E007"),
  Department = c("HR", "IT", "Finance", "HR", "IT", "HR", "Finance"),
  Salary = c(60000, 80000, 75000, 70000, 85000, 62000, 77000),
  Bonus = c(5000, 8000, 7500, 6000, 9000, 5500, 7000)
)

print(employee_data)


# Using Across() to summarise multiple numeric columns
employee_data %>%
  group_by(Department) %>%
  summarize(across(c(Salary, Bonus), list(
    mean = mean,
    sum = sum, median = median, sd = sd
  )))

The above figure shows that the across() function applies the sum() and mean() functions to the salary and bonus columns grouped by the department column.
That’s all!

Krunal Lathiya is a seasoned Computer Science expert with over eight years in the tech industry. He boasts deep knowledge in Data Science and Machine Learning. Versed in Python, JavaScript, PHP, R, and Golang. Skilled in frameworks like Angular and React and platforms such as Node.js. His expertise spans both front-end and back-end development. His proficiency in the Python language stands as a testament to his versatility and commitment to the craft.