The scale() function in R centers (subtracting the mean) and/or scales (dividing by the standard deviation) the columns of a numeric matrix or data frame. It transforms data to have a mean of 0 and a standard deviation of 1 by default, which is equivalent to computing z-scores.
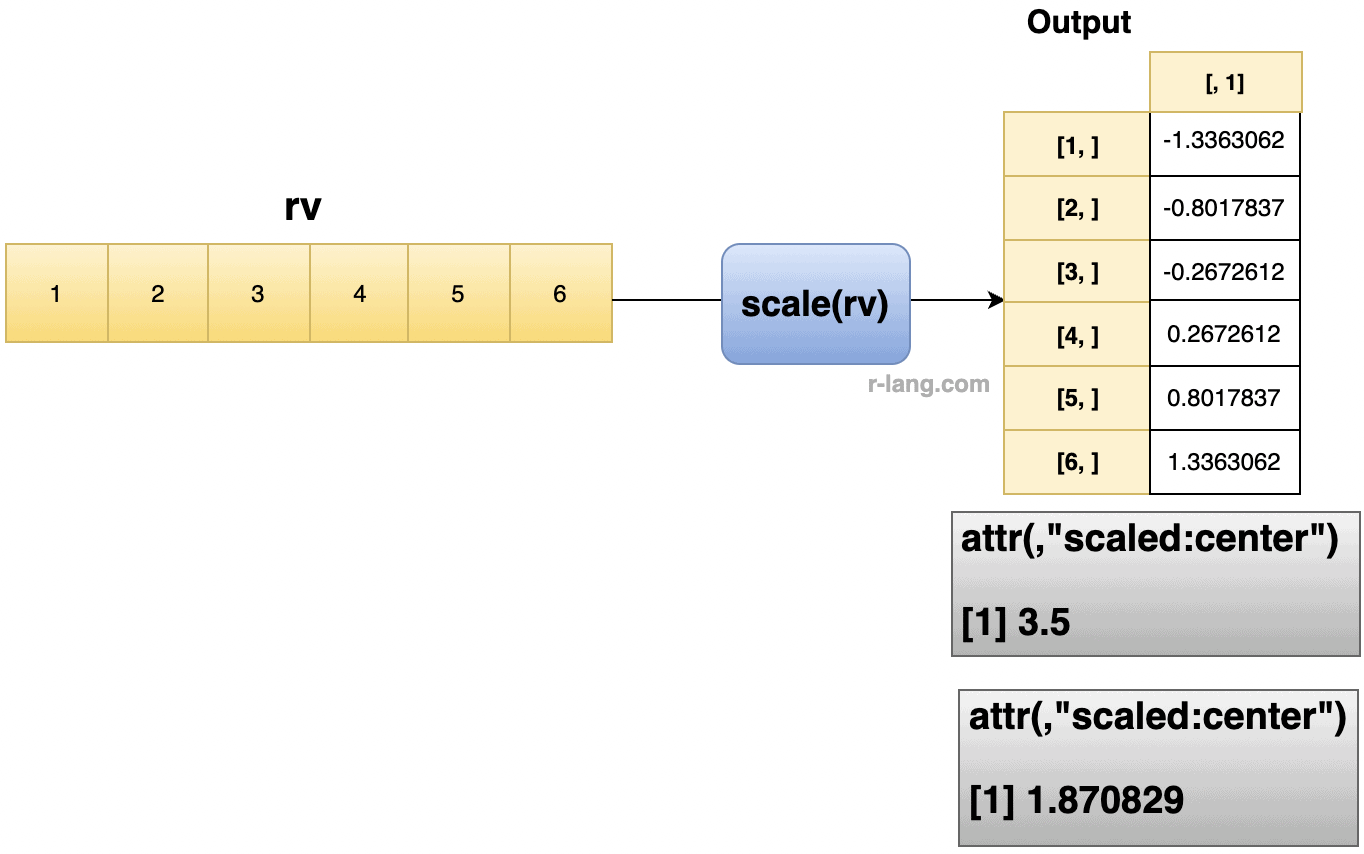
vec <- c(1, 2, 3, 4, 5, 6)

scale(vec)

# Output:
# [,1]
# [1,] -1.3363062
# [2,] -0.8017837
# [3,] -0.2672612
# [4,] 0.2672612
# [5,] 0.8017837
# [6,] 1.3363062
# attr(,"scaled:center")
# [1] 3.5
# attr(,"scaled:scale")
# [1] 1.870829
Syntax
scale(x, center = TRUE, scale = TRUE)Parameters
| Argument | Description |
| x (required) | It represents the data that needs to be scaled. For example, matrix, data frame, vector. |
| center | It is a logical or numeric-like vector.
If it is set to TRUE, it subtracts the column means from each column. If FALSE, no centering is applied |
| scale | It represents a logical or numeric vector.
If TRUE, divides each column by its standard deviation (using sd() with n-1 denominator for sample variance). If FALSE, it does not apply any scaling. |
Scale the column values in a data frame
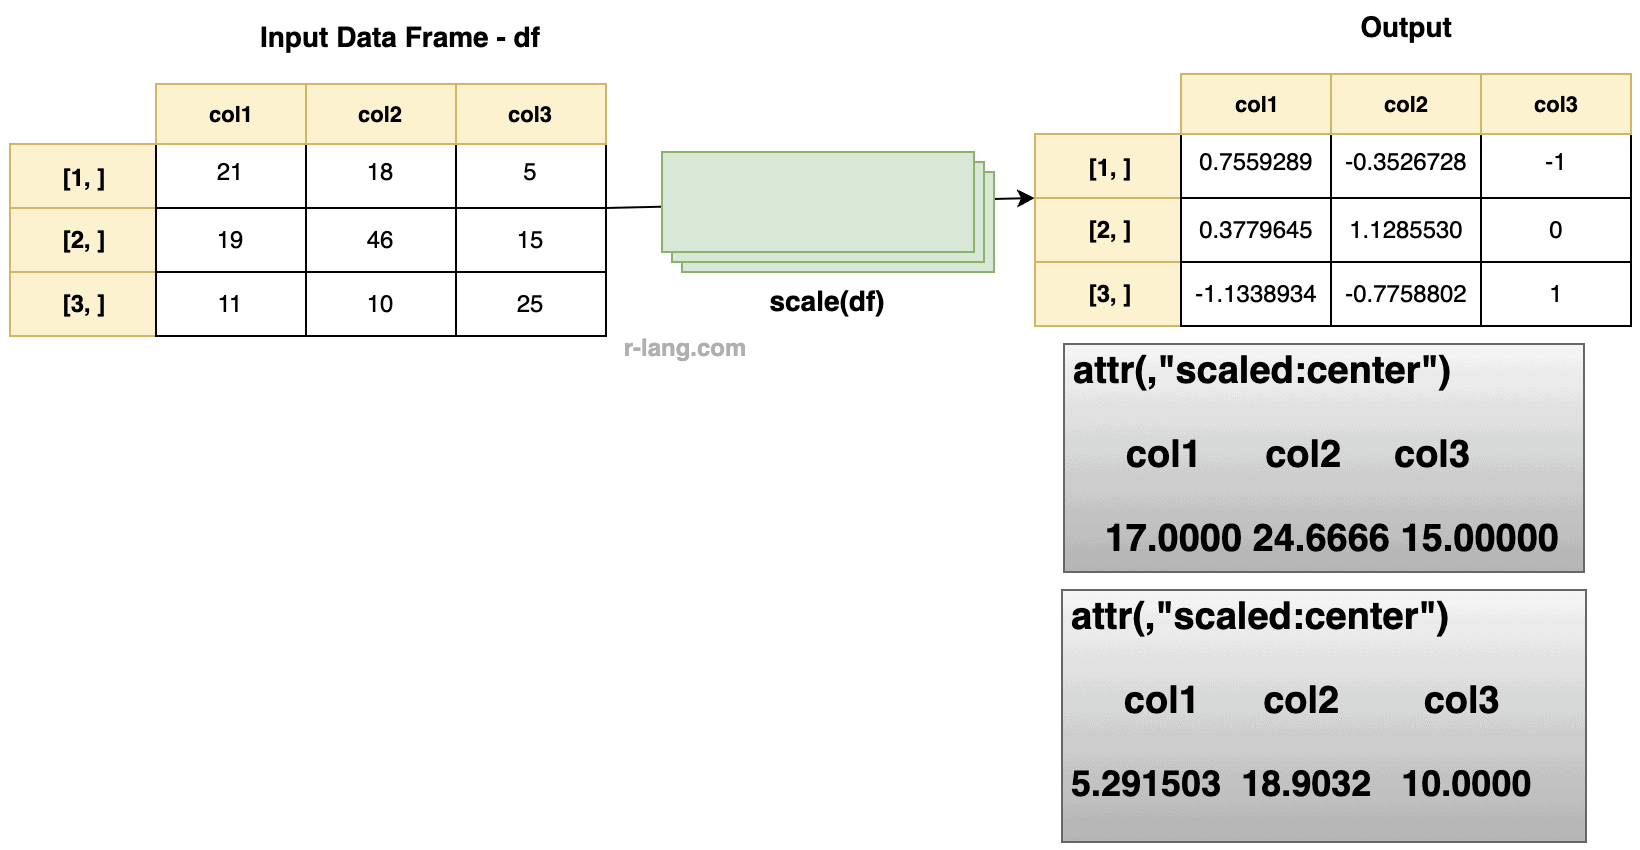
df <- data.frame(
  "col1" = c(21, 19, 11),
  "col2" = c(18, 46, 10),
  "col3" = c(5, 15, 25)
)

scale(df)
Output

Scaling the values in the Matrix
Let’s define a 3×3 matrix and scale it.
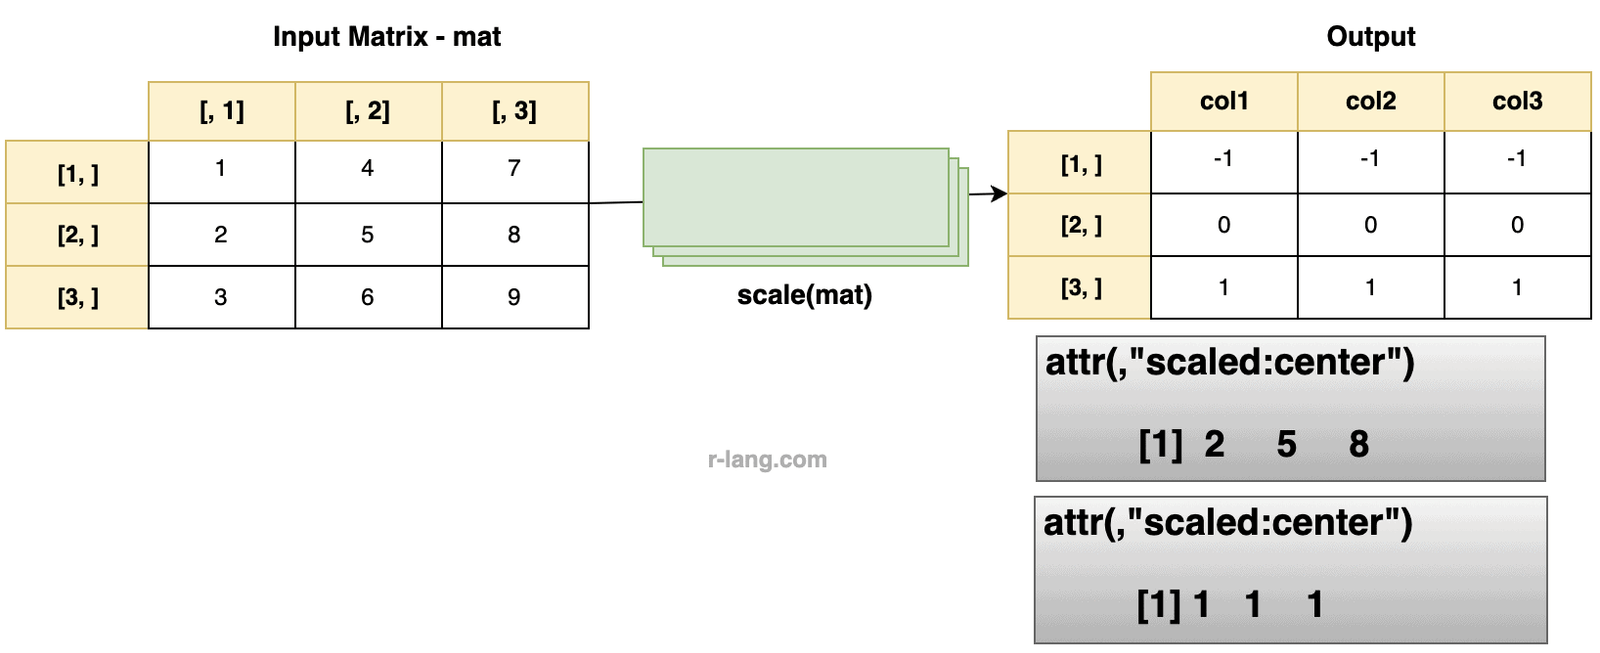
mat <- matrix(1:9, ncol = 3)

scale(mat)

# Output:
#       [,1] [,2]   [,3]
# [1,]   -1   -1.    -1
# [2,]    0    0      0
# [3,]    1    1      1
# attr(,"scaled:center")
# [1] 2  5  8
# attr(,"scaled:scale")
# [1] 1  1  1
If we set ‘scale‘ = FALSE, we try to force the scaling feature of this function to be turned off and that only centralization of the data values will occur.
mat <- matrix(1:9, ncol = 3)

scale(mat, center = c(1, 2, 3), scale = FALSE)

# Output:
#       [,1] [,2] [,3]
# [1,]   0    2    4
# [2,]   1    3    5
# [3,]   2    4    6
# attr(,"scaled:center")
# [1] 1  2  3
Passing center = FALSE
We can scale the values of a matrix by setting center = FALSE in this function.
mat <- matrix(1:9, ncol = 3)

scale(mat, center = FALSE, scale = c(1, 2, 3))
Output
     [,1] [,2]  [,3]
[1,]  1    2.0  2.333333
[2,]  2    2.5  2.666667
[3,]  3    3.0  3.000000
attr(,"scaled:scale")
[1] 1   2   3
Using without Scales Or Centers
mat <- matrix(1:9, ncol = 3)

scale(mat, center = FALSE, scale = FALSE)

# Output:
     [,1]  [,2] [,3]
[1,]  1     4    7
[2,]  2     5    8
[3,]  3     6    9
After scaling, each column will have a mean of zero and a standard deviation of one, assuming center = TRUE and scale = TRUE.
It’s essential to apply the same scaling parameters to new data (e.g., test data in machine learning) that were used to scale the training data.

Krunal Lathiya is a seasoned Computer Science expert with over eight years in the tech industry. He boasts deep knowledge in Data Science and Machine Learning. Versed in Python, JavaScript, PHP, R, and Golang. Skilled in frameworks like Angular and React and platforms such as Node.js. His expertise spans both front-end and back-end development. His proficiency in the Python language stands as a testament to his versatility and commitment to the craft.