The dplyr::slice() function subsets rows by their position or index within a data frame.
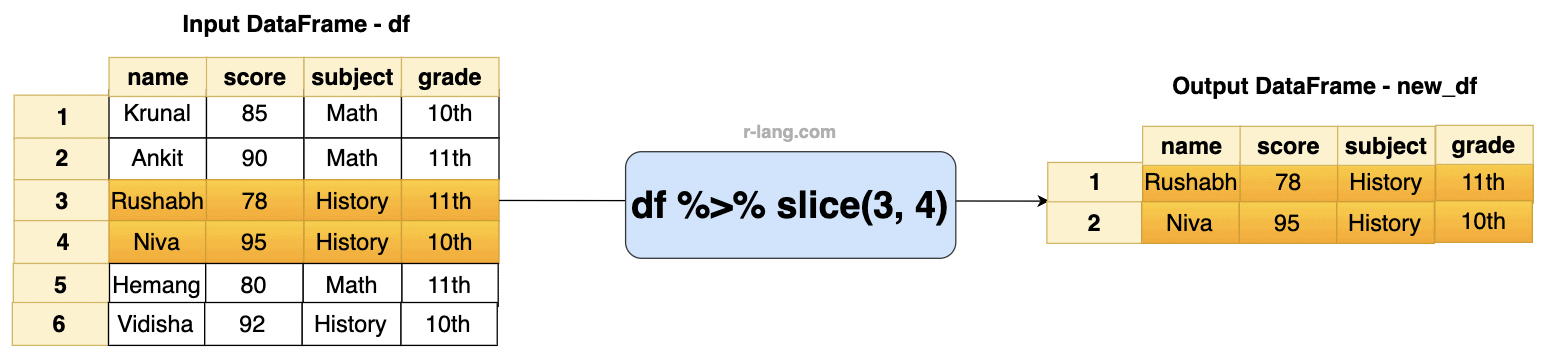
If you want to select specific rows from a data frame, use the slice() function and pass the index of the specific rows, and it will return a data frame containing those rows.
In the above figure, we selected rows 3 and 4 based on their position, without applying any grouping or other criteria.
This method is beneficial when you want to select specific rows, get the top N or bottom N rows after sorting, exclude rows, use group_by(), and combine with other dplyr functions.
slice(.df, ..., .by = NULL, .preserve = FALSE)
| Name | Value |
| .df | It is either a data frame or an extension of it, like a tibble. |
| … | It can be row indices (positive or negative integers, or functions like n()). |
| .by (Optional) | It is a grouping specification without permanent grouping. |
| .preserve | Whether to preserve a grouping structure. If TRUE, it makes it as it is. |
Let’s select rows 3 and 4:
library(dplyr)
df <- data.frame(
name = c("Krunal", "Ankit", "Rushabh", "Niva", "Hemang", "Vidisha"),
score = c(85, 90, 78, 95, 80, 92),
subject = c("Math", "Math", "History", "History", "Math", "History"),
grade = c("10th", "11th", "11th", "10th", "11th", "10th")
)
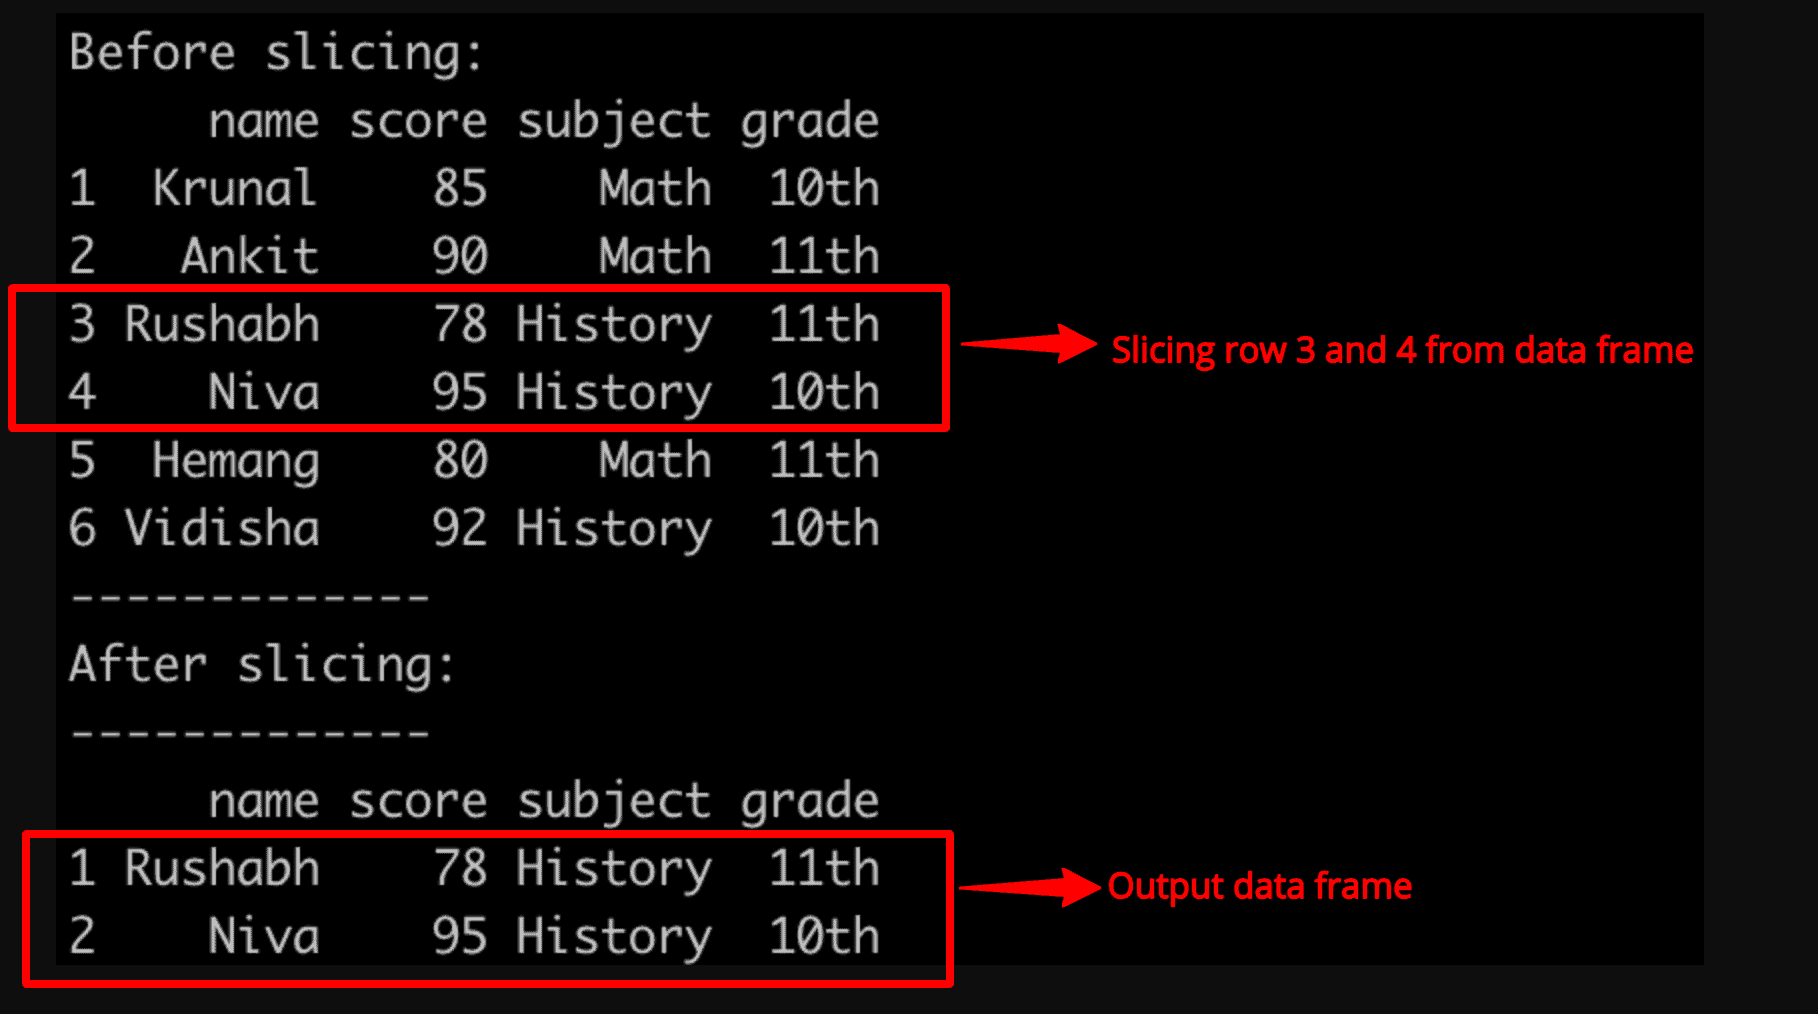
cat("Before slicing: ", "\n")
df
new_df <- df %>% slice(3, 4)
cat("-------------", "\n")
cat("After slicing: ", "\n")
cat("-------------", "\n")
new_df
Output
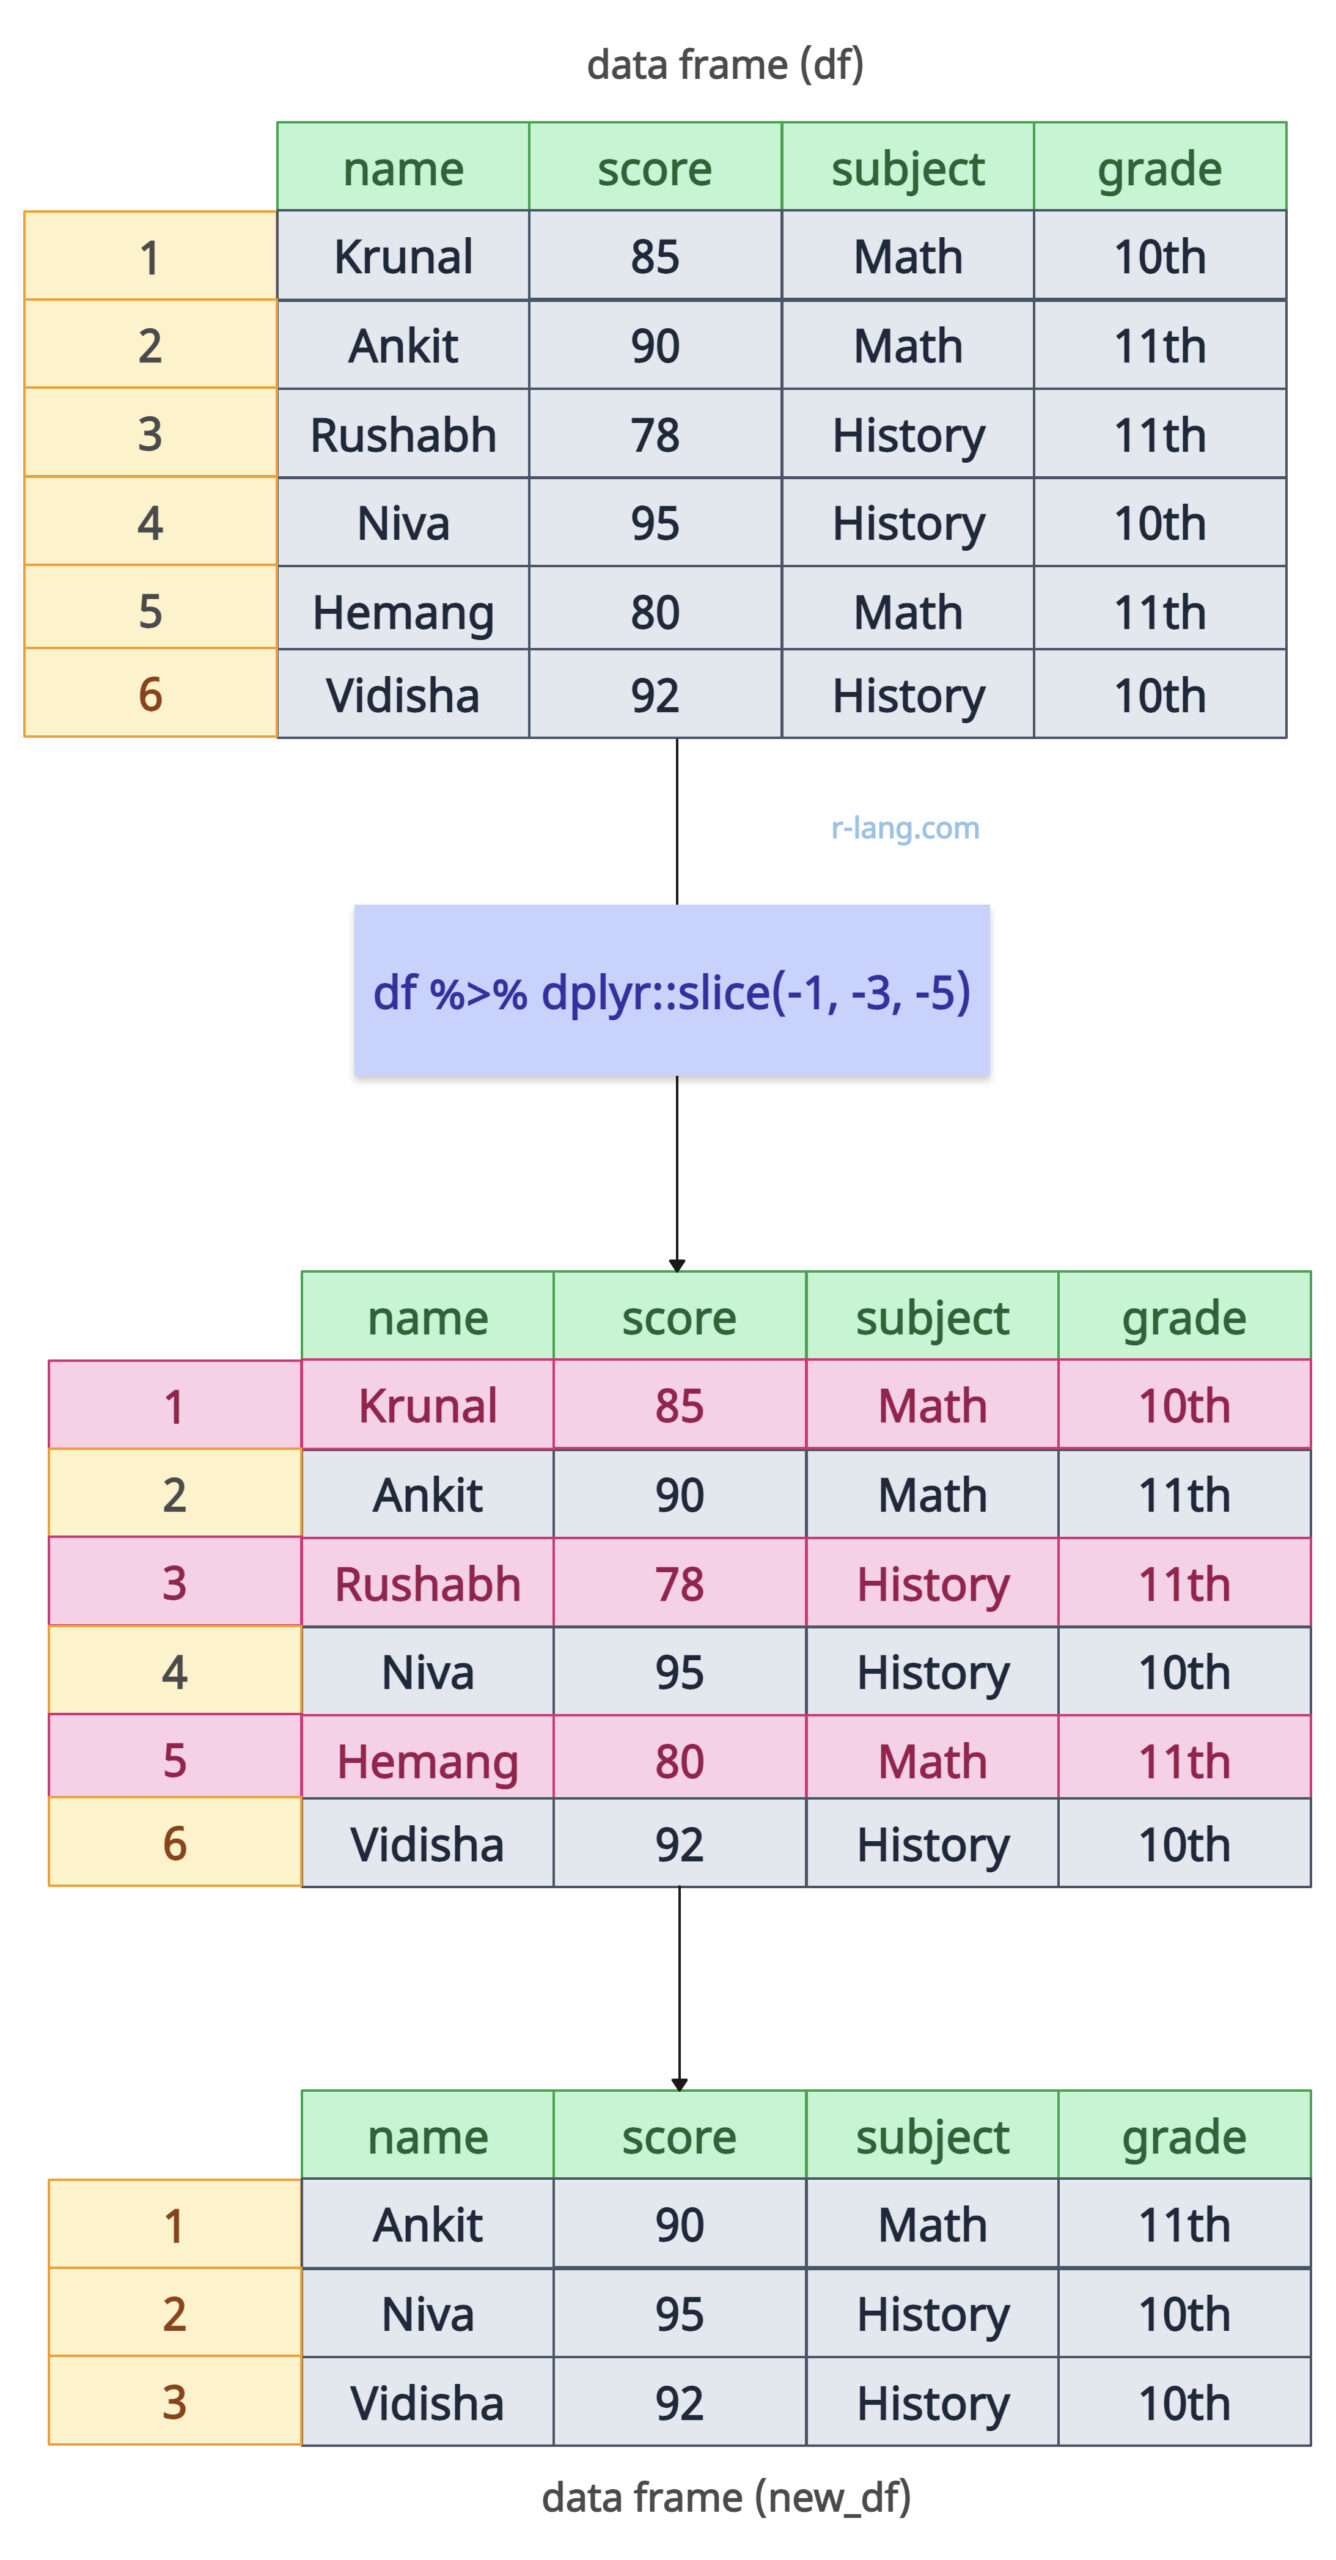
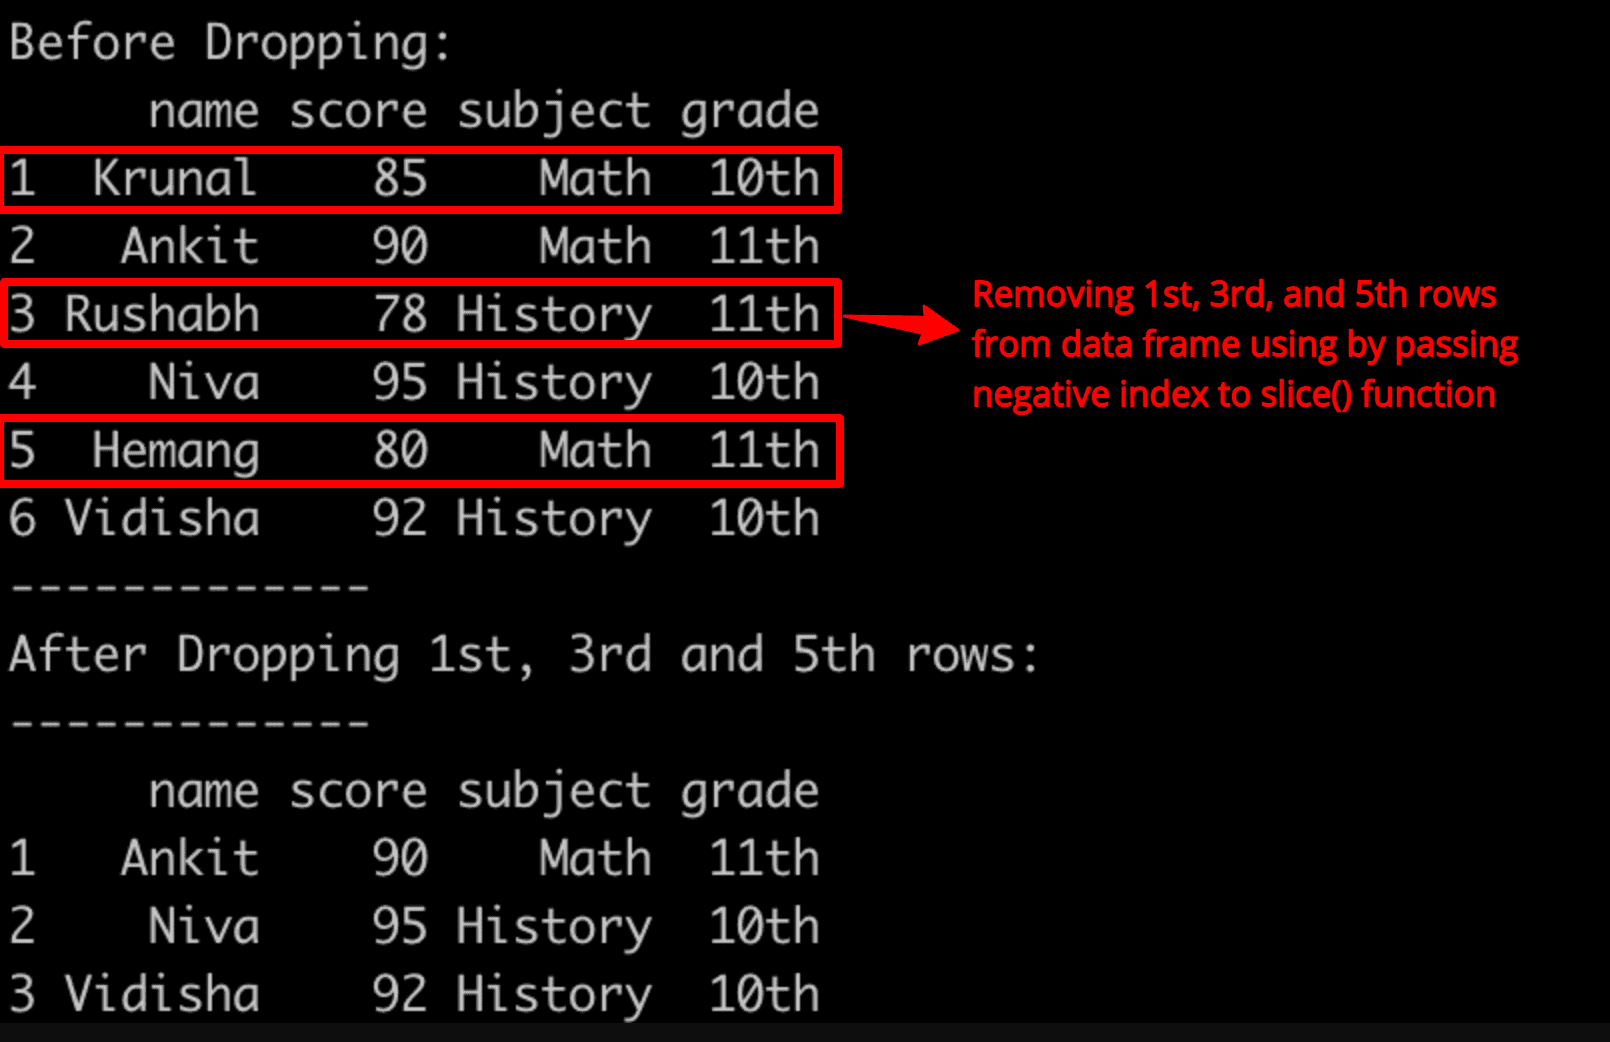
If you want to exclude specific rows from the output data frame, prepend the hyphen (-) before its position, and that specific row will be removed.
library(dplyr)

df <- data.frame(
  name = c("Krunal", "Ankit", "Rushabh", "Niva", "Hemang", "Vidisha"),
  score = c(85, 90, 78, 95, 80, 92),
  subject = c("Math", "Math", "History", "History", "Math", "History"),
  grade = c("10th", "11th", "11th", "10th", "11th", "10th")
)

cat("Before Dropping: ", "\n")
df

new_df <- df %>% slice(-1, -3, -5)

cat("-------------", "\n")
cat("After Dropping 1st, 3rd and 5th rows:", "\n")
cat("-------------", "\n")

new_df
Output
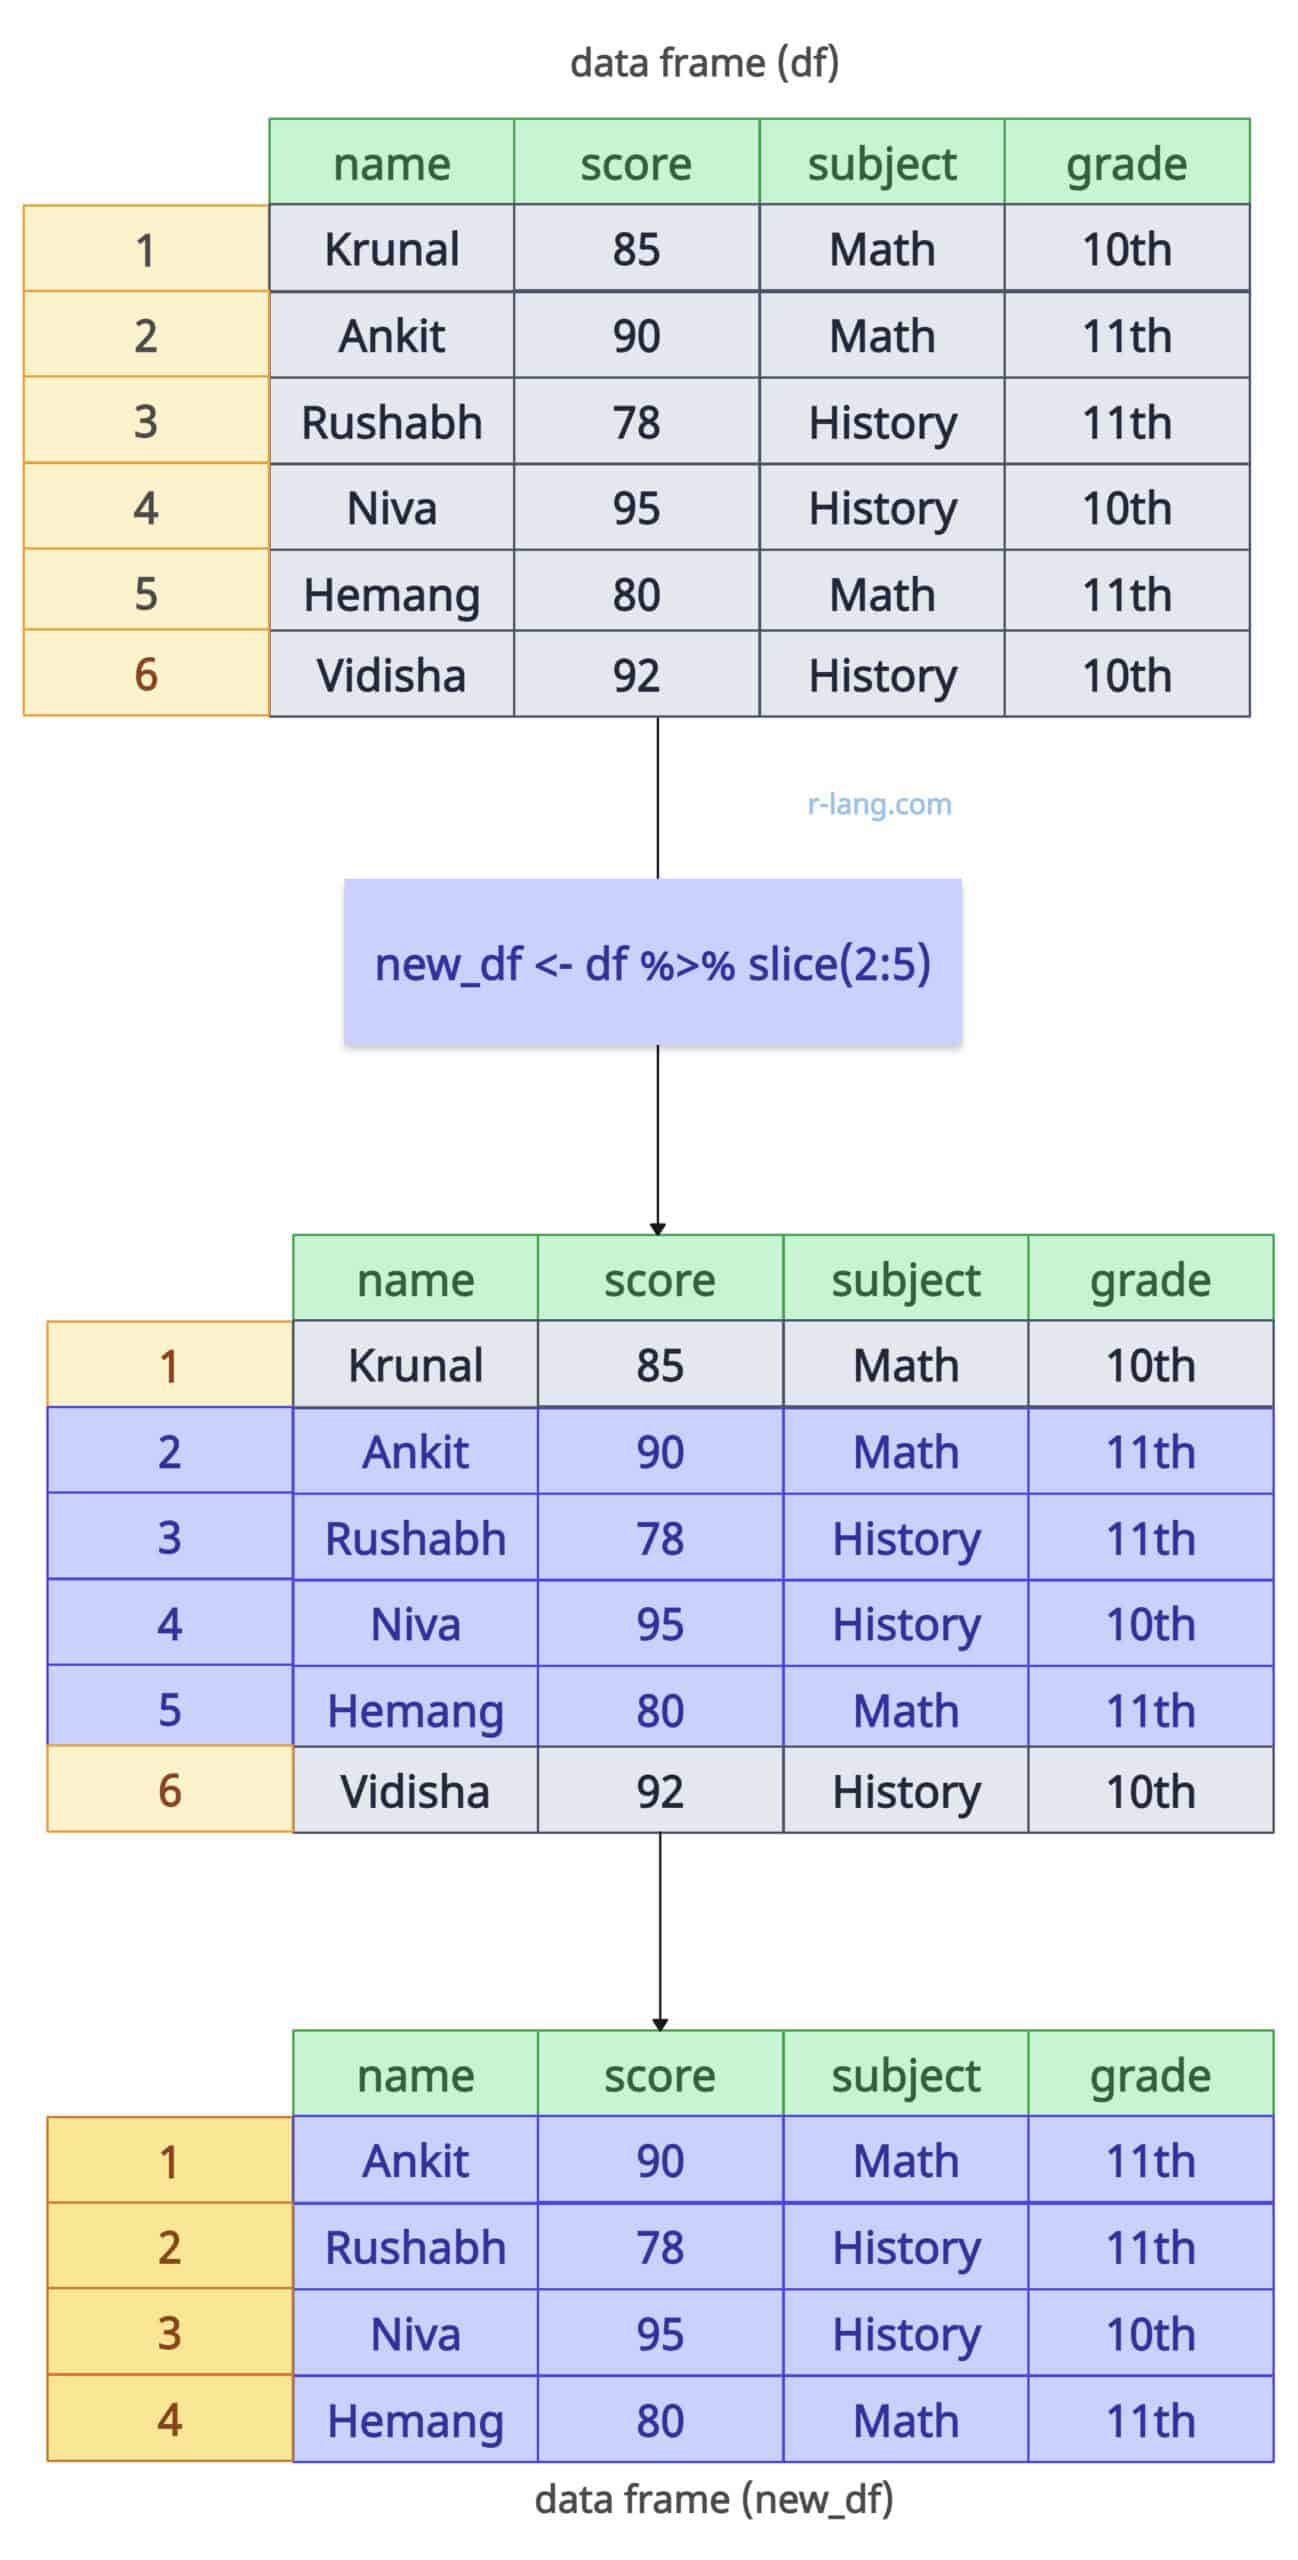
You can slice a range of rows using the “:” operator.
library(dplyr)

df <- data.frame(
  name = c("Krunal", "Ankit", "Rushabh", "Niva", "Hemang", "Vidisha"),
  score = c(85, 90, 78, 95, 80, 92),
  subject = c("Math", "Math", "History", "History", "Math", "History"),
  grade = c("10th", "11th", "11th", "10th", "11th", "10th")
)

df

new_df <- df %>% slice(2:5)

new_df
Output
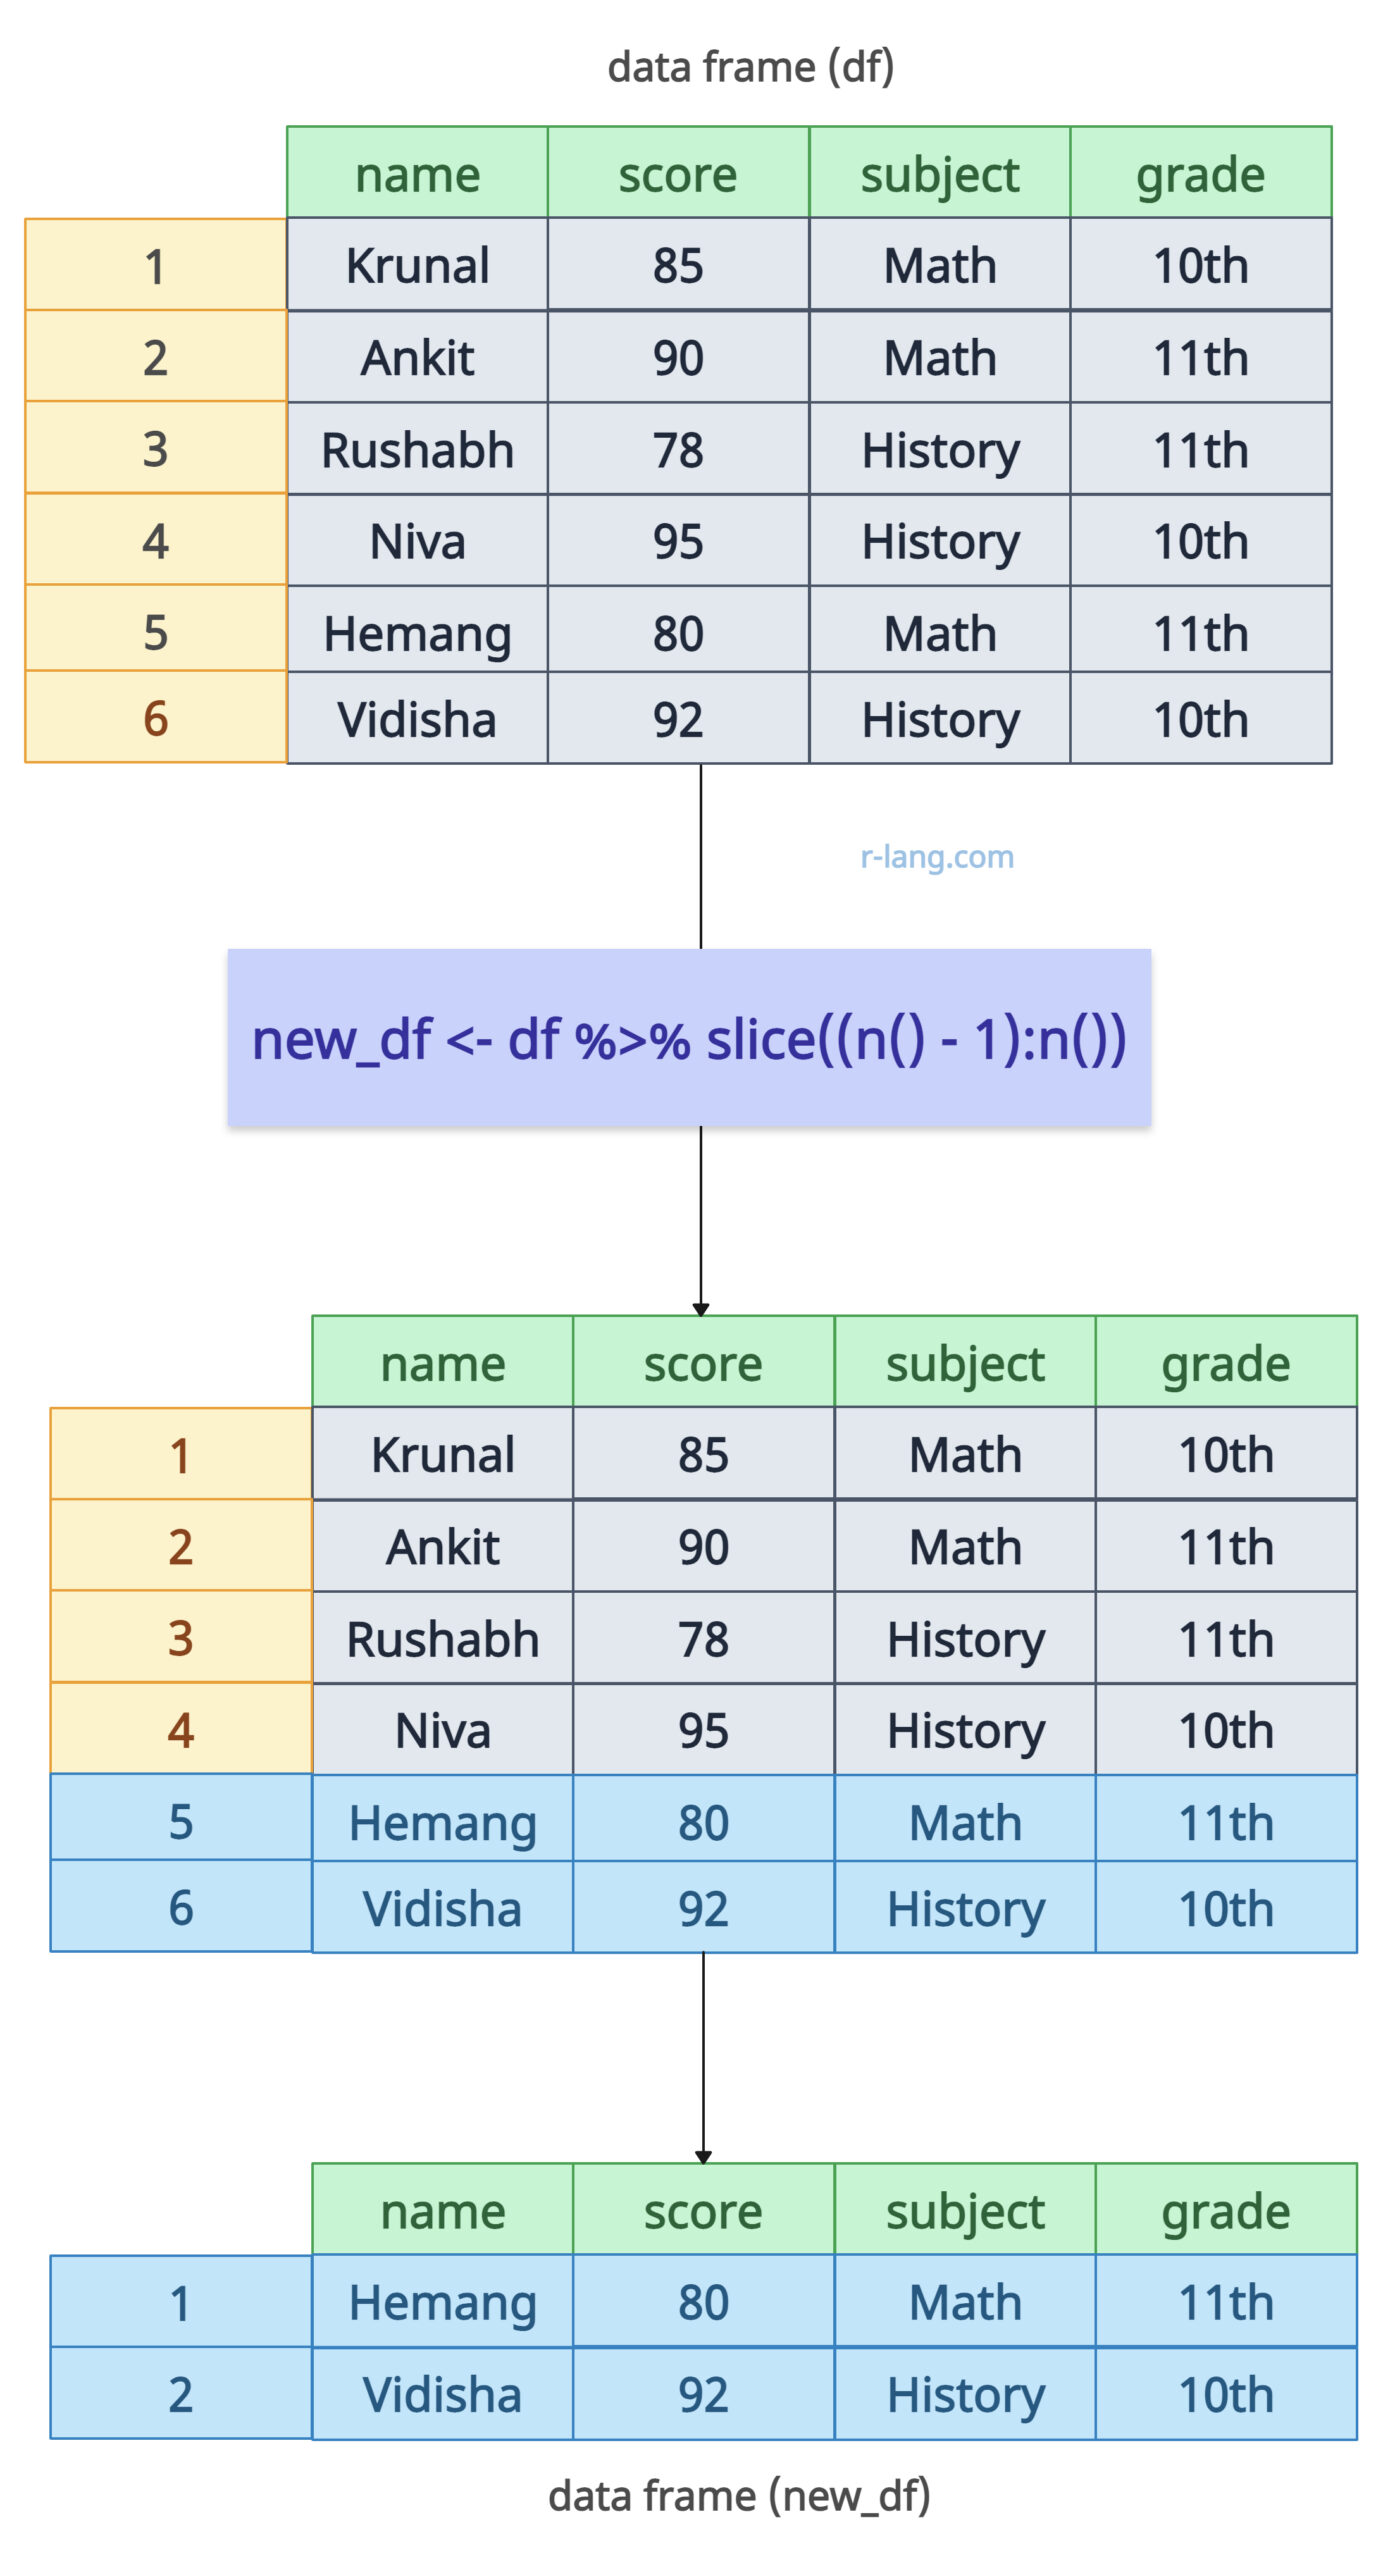
Using the n() function, we can dynamically slice rows, which ultimately returns the total number of rows in the data frame.
Let’s select the last two rows dynamically using the slice(), n(), and “:” operators.
library(dplyr)

df <- data.frame(
  name = c("Krunal", "Ankit", "Rushabh", "Niva", "Hemang", "Vidisha"),
  score = c(85, 90, 78, 95, 80, 92),
  subject = c("Math", "Math", "History", "History", "Math", "History"),
  grade = c("10th", "11th", "11th", "10th", "11th", "10th")
)

df

# Usage of slice() with n() to select last two rows
new_df <- df %>% slice((n() - 1):n())

new_df
Output
Using the slice() function, we select rows from the second-to-last row to the last row, which means the last two rows are dynamically selected.
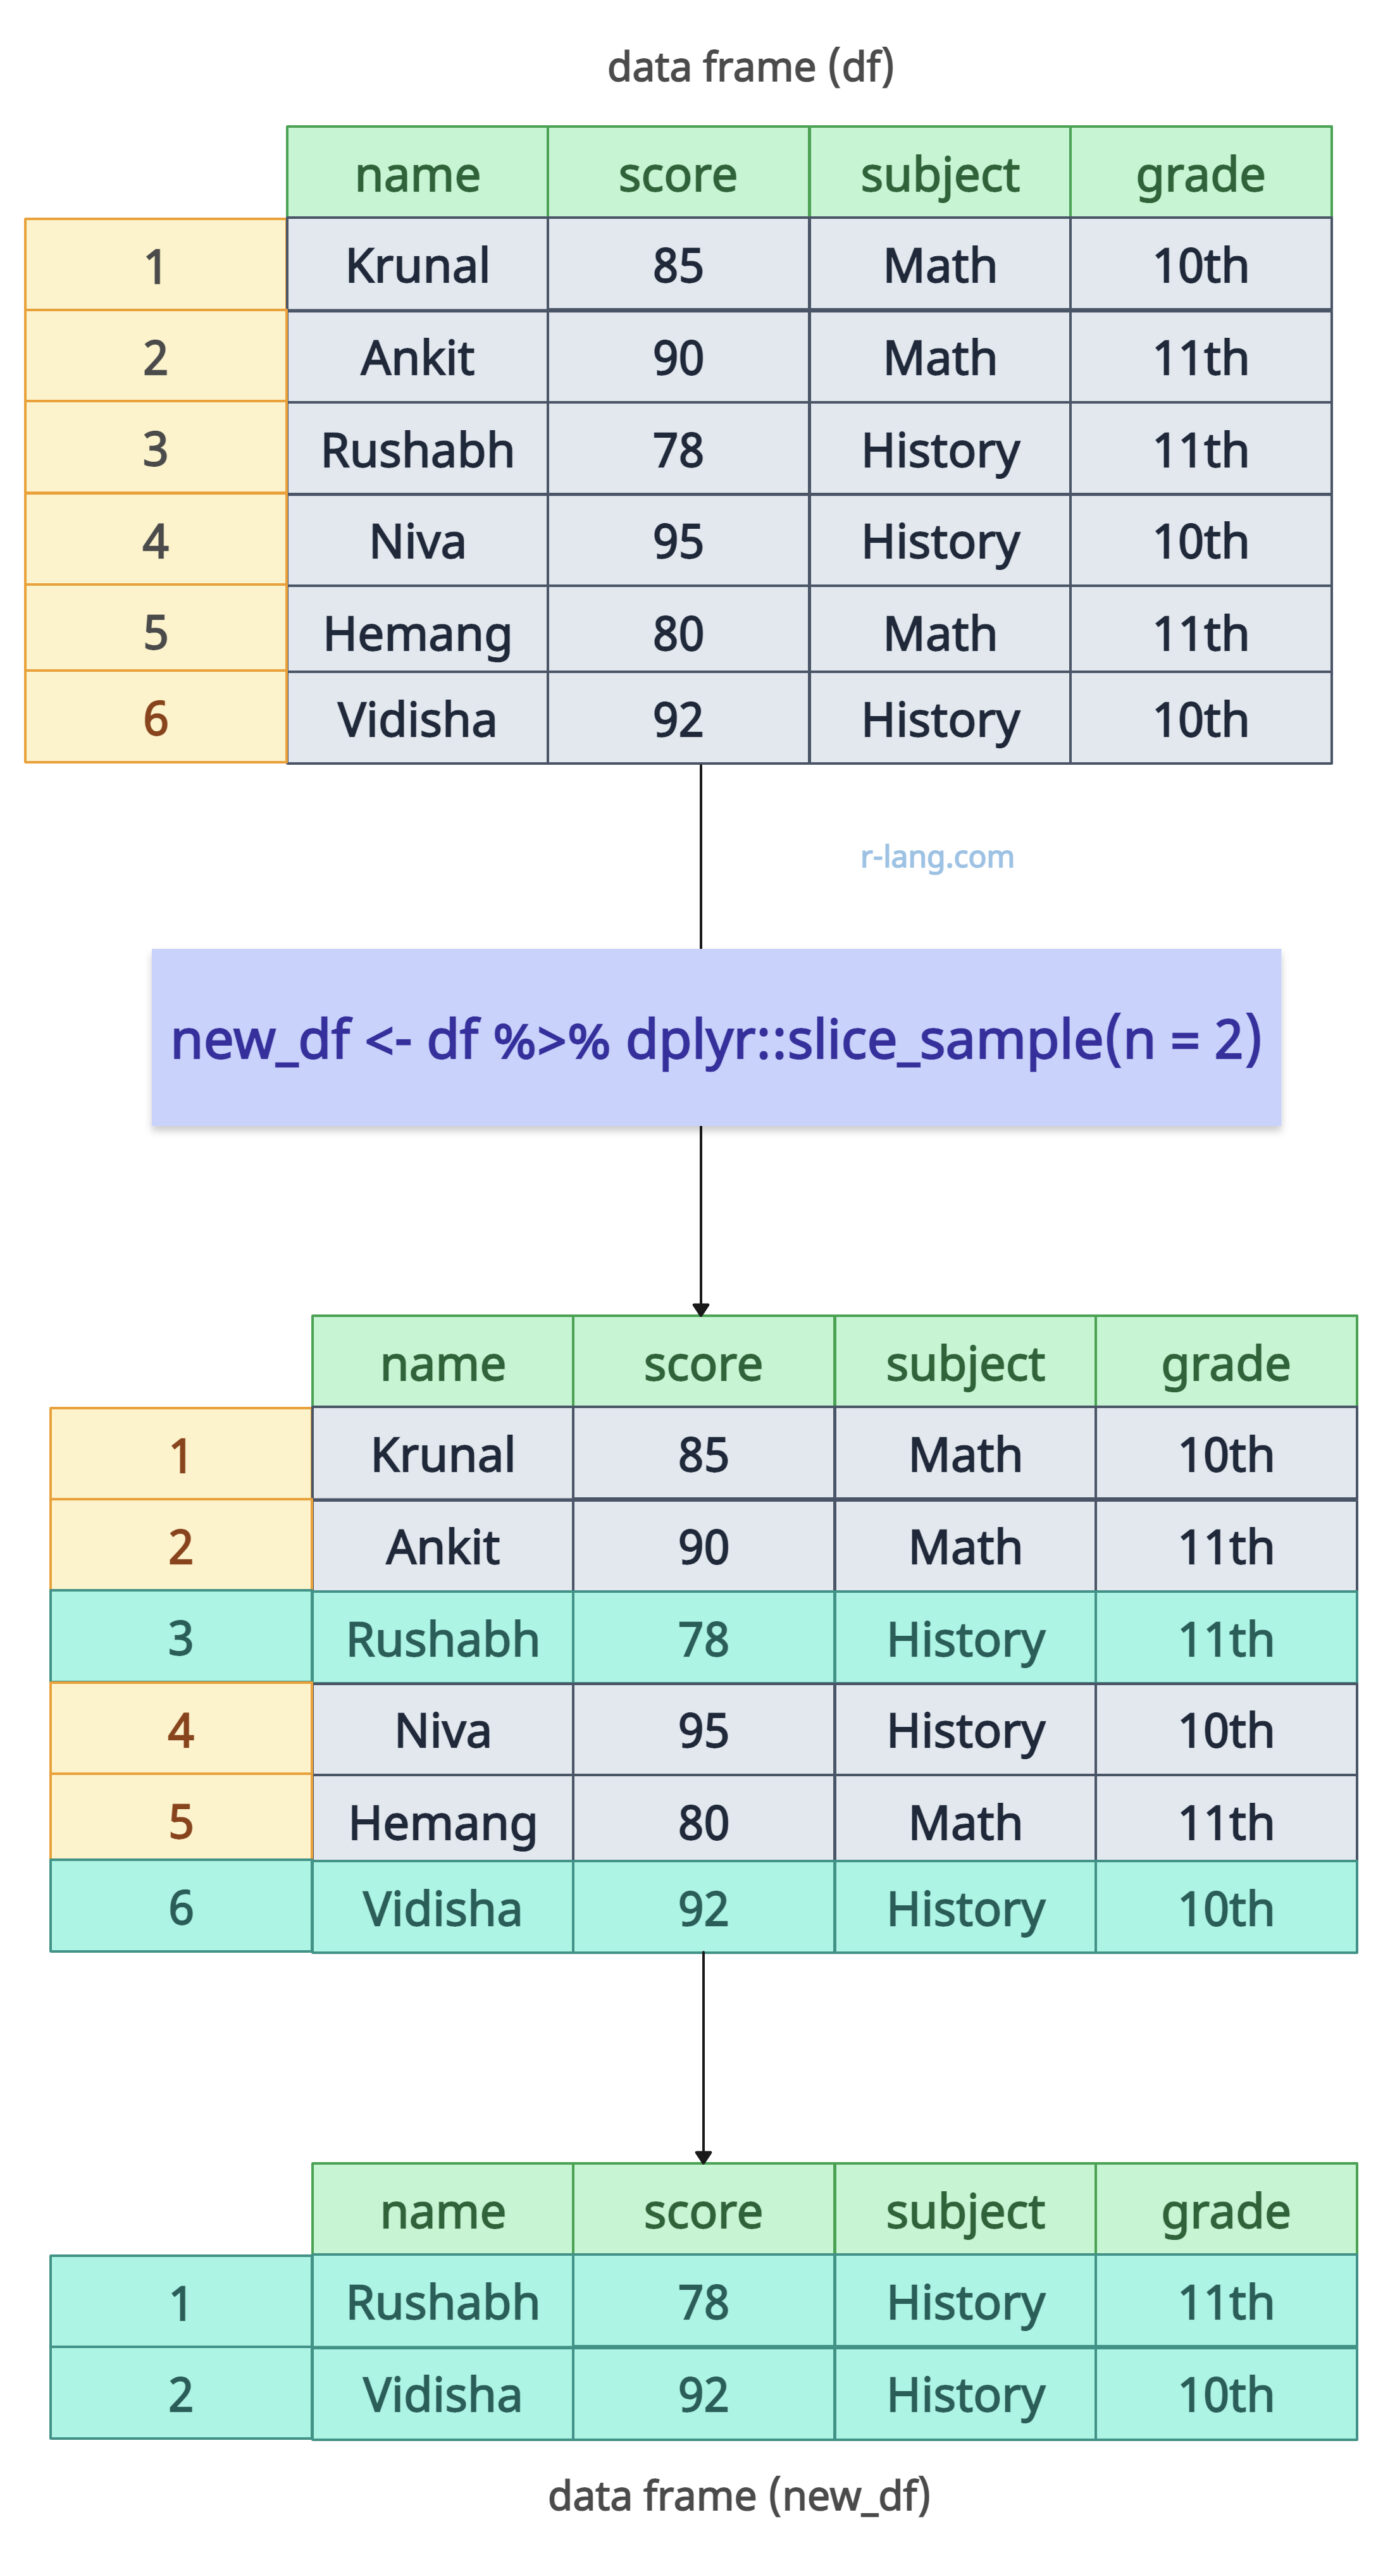
The dplyr package provides a complementary function called “slice_sample()” that you can use to slice any number of rows randomly.
set.seed(123) # For reproducibility
library(dplyr)

df <- data.frame(
  name = c("Krunal", "Ankit", "Rushabh", "Niva", "Hemang", "Vidisha"),
  score = c(85, 90, 78, 95, 80, 92),
  subject = c("Math", "Math", "History", "History", "Math", "History"),
  grade = c("10th", "11th", "11th", "10th", "11th", "10th")
)

df

# dplyr random slicing (corrected)
new_df <- df %>% slice_sample(n = 2)

new_df
Output
By setting the seed, we ensured that we would reproduce the same results every time, even if the selection were made randomly.
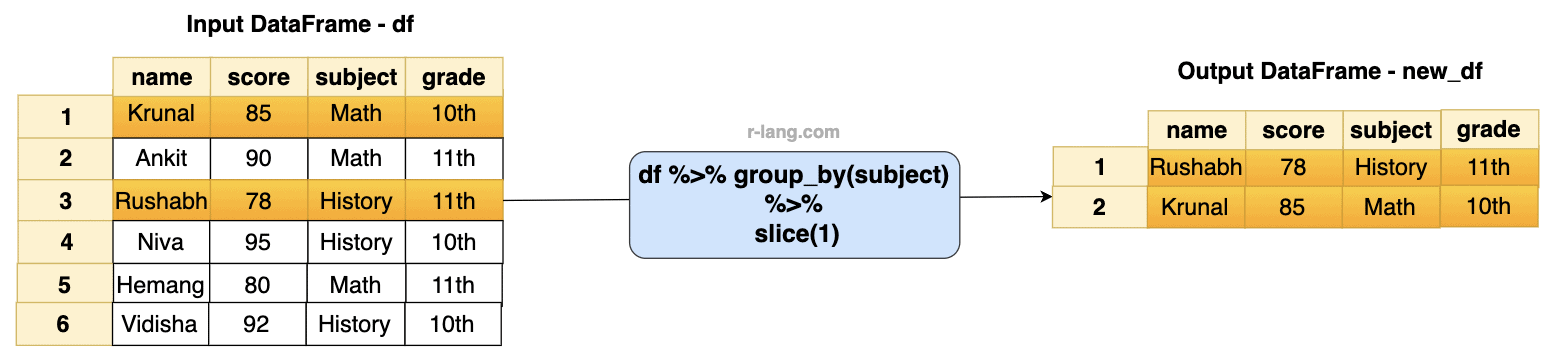
The dplyr function includes the group_by() method, which enables us to select rows by specific groups. Let’s get the first row for each subject.
For example, in our data frame, there are only two subjects. So, get only the first row for each subject.
library(dplyr)

df <- data.frame(
  name = c("Krunal", "Ankit", "Rushabh", "Niva", "Hemang", "Vidisha"),
  score = c(85, 90, 78, 95, 80, 92),
  subject = c("Math", "Math", "History", "History", "Math", "History"),
  grade = c("10th", "11th", "11th", "10th", "11th", "10th")
)

cat("Before slicing: ", "\n")
df

new_df <- df %>%
  group_by(subject) %>%
  slice(1)
Output
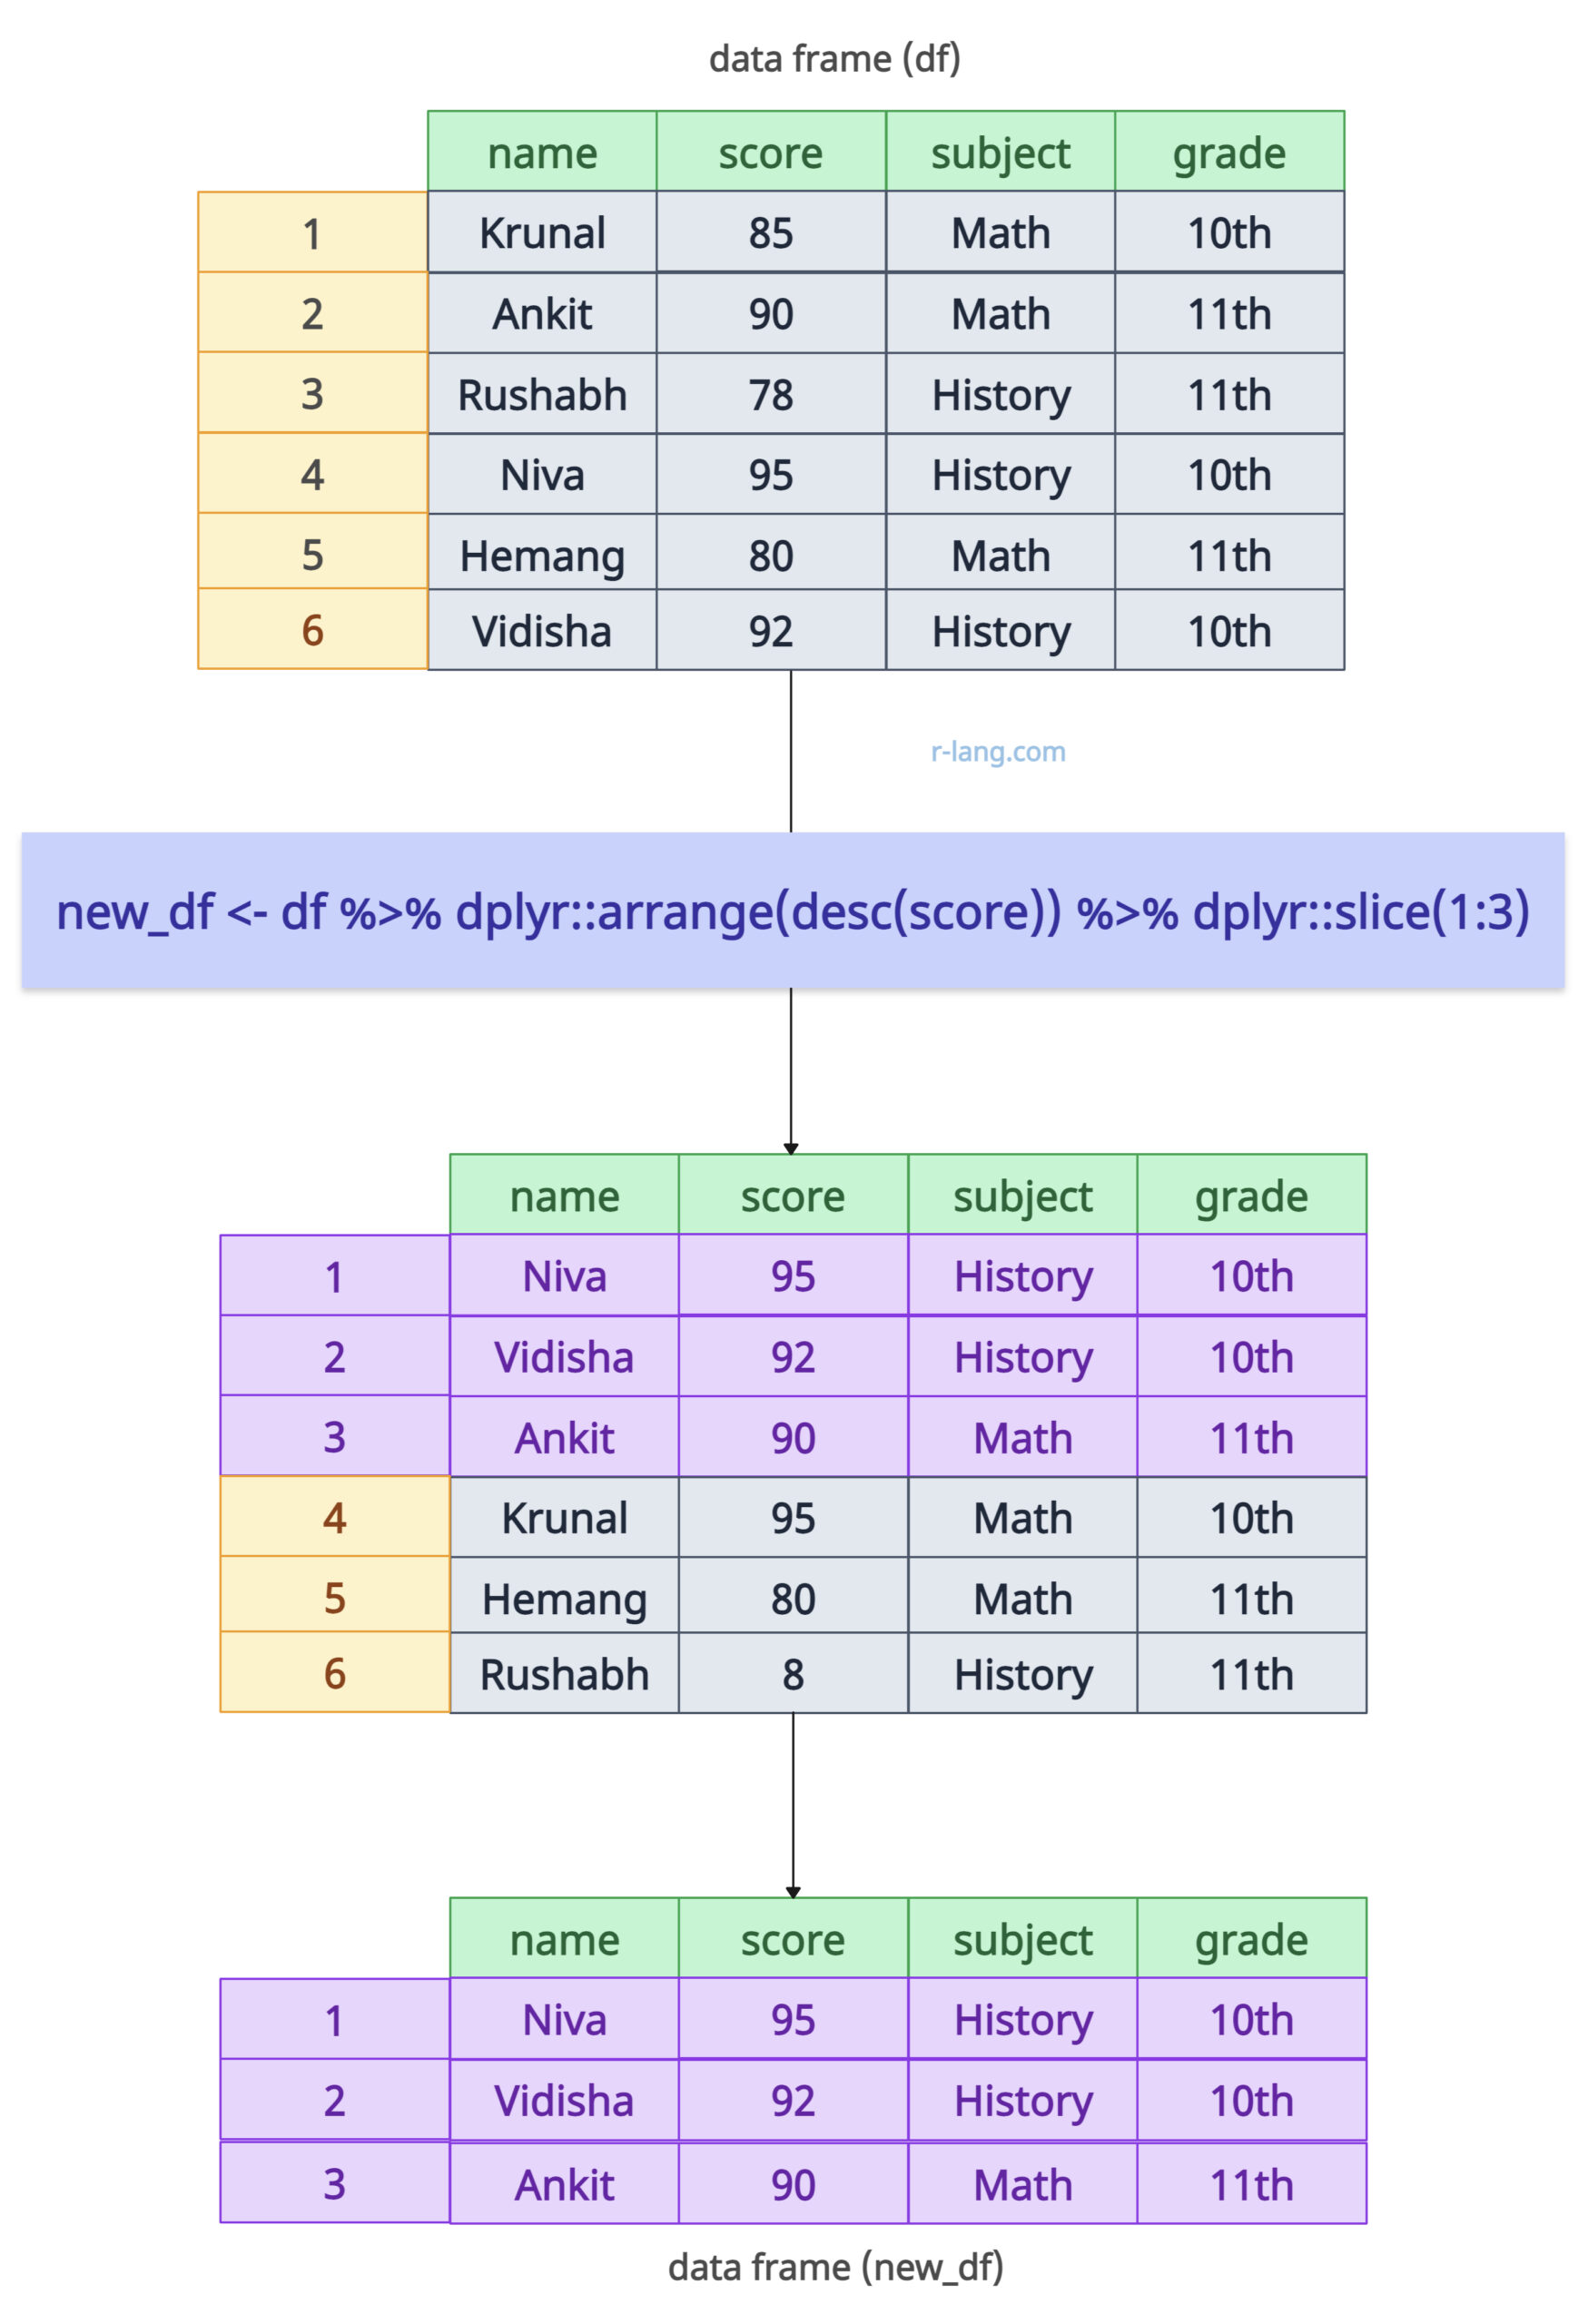
If you want to sort the data before slicing, you can use dplyr’s arrange() function.
library(dplyr)

df <- data.frame(
  name = c("Krunal", "Ankit", "Rushabh", "Niva", "Hemang", "Vidisha"),
  score = c(85, 90, 78, 95, 80, 92),
  subject = c("Math", "Math", "History", "History", "Math", "History"),
  grade = c("10th", "11th", "11th", "10th", "11th", "10th")
)

df

# Sort the data frame based on score in descending order
# and then slice first 3 rows
new_df <- df %>% arrange(desc(score)) %>% slice(1:3)

new_df
Output
The above output figure shows that we sorted the data frame in descending order based on the “score” column and then sliced the first three rows in the output data frame.
The slice() function gracefully handles out-of-bounds indices (e.g., slice(100) returns an empty slice) and doesn’t throw any errors.
Krunal Lathiya is a seasoned Computer Science expert with over eight years in the tech industry. He boasts deep knowledge in Data Science and Machine Learning. Versed in Python, JavaScript, PHP, R, and Golang. Skilled in frameworks like Angular and React and platforms such as Node.js. His expertise spans both front-end and back-end development. His proficiency in the Python language stands as a testament to his versatility and commitment to the craft.
The scale() function in R centers (subtracting the mean) and/or scales (dividing by the standard…
To rename a file in R, you can use the file.rename() function. It renames a…
The prop.table() function in R calculates the proportion or relative frequency of values in a…
The exp() is a built-in function that calculates the exponential of its input, raising Euler's…
The split() function divides the input data into groups based on some criteria, typically specified…
The colMeans() function in R calculates the arithmetic mean of columns in a numeric matrix,…