Most real-world data resides in external sources, including CSVs, Excels, Texts, or Databases. To bring back the data from these external sources, we need a bridge or function that we can use to analyze these data into our R ecosystem and further manipulate it to get the required results. That’s where a base function like read.table() comes into the picture.
read.table()
The read.table() function imports external tabular data into R data frames for analysis and manipulation. It connects R to the outside world datasets. You can use it as the foundation for any data analysis project.
Syntax
# Reading a CSV file with a header row
df <- read.table("data.csv", header = TRUE, sep = ",", colClasses, na.strings = "")

# Reading a tab-separated text file without a header
df <- read.table("data.txt", header = FALSE, sep = "\t")
Parameters
| Name | Value |
| file | It is a character string that specifies an input file we want to read. |
| header | It is a header argument. If set to TRUE, it suggests a first row of Data Frame. |
| sep | It specifies a separator character used to delimit the columns in the file. |
| colClasses | It specifies column classes. |
| na.strings | It specifies which strings should be interpreted as missing values. |
Sample dataset
Before proceeding further, we need to create an external data source if we have not already:
You can skip this step if you have a data source.
We can create a CSV file using R by the command below:
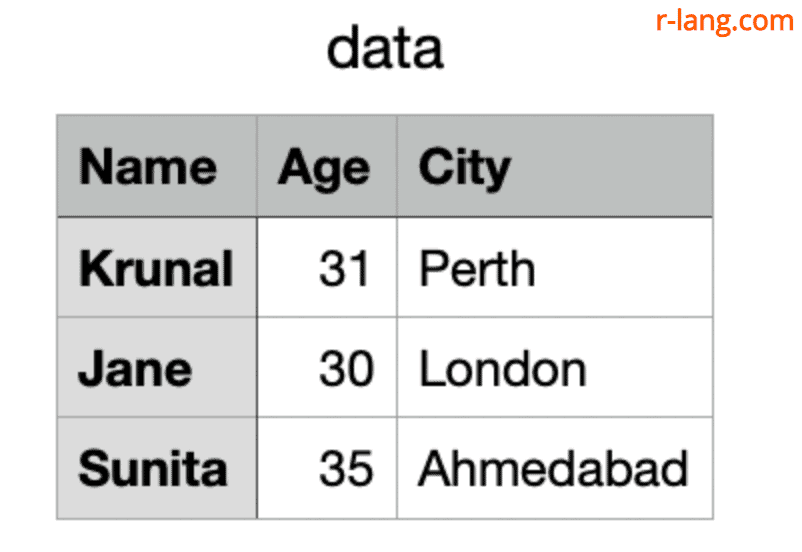
cat("Name,Age,City\nKrunal,31,Perth\nJane,30,London\nSunita,35,Ahmedabad\n", file = "data.csv")Output CSV file
It will create a “data.csv” file that looks like this:
Basic CSV Import with Header
We will read the sample “data.csv” file with a header in our R environment:
# Reading a CSV file
df <- read.table("data.csv", header = TRUE, sep = ",")

print(df)
Output

You can see from the above output of RStudio that we passed header = TRUE, which means that the output must contain the first row that has column names. The sep = “,” specifies the comma as the column separator.
Tab-Separated File (TSV) without Header
Let’s create a TSV (Tab-Separated File) without a header and import it using read.table() function in RStudio.
# Creating a sample TSV file (data.tsv)
cat("John\t25\tNew York\nYogita\t30\tDelhi\nPeter\t22\tParis\n", file = "data.tsv")

# Read the TSV file
df <- read.table("data.tsv", header = FALSE, sep = "\t")

print(df)
Output
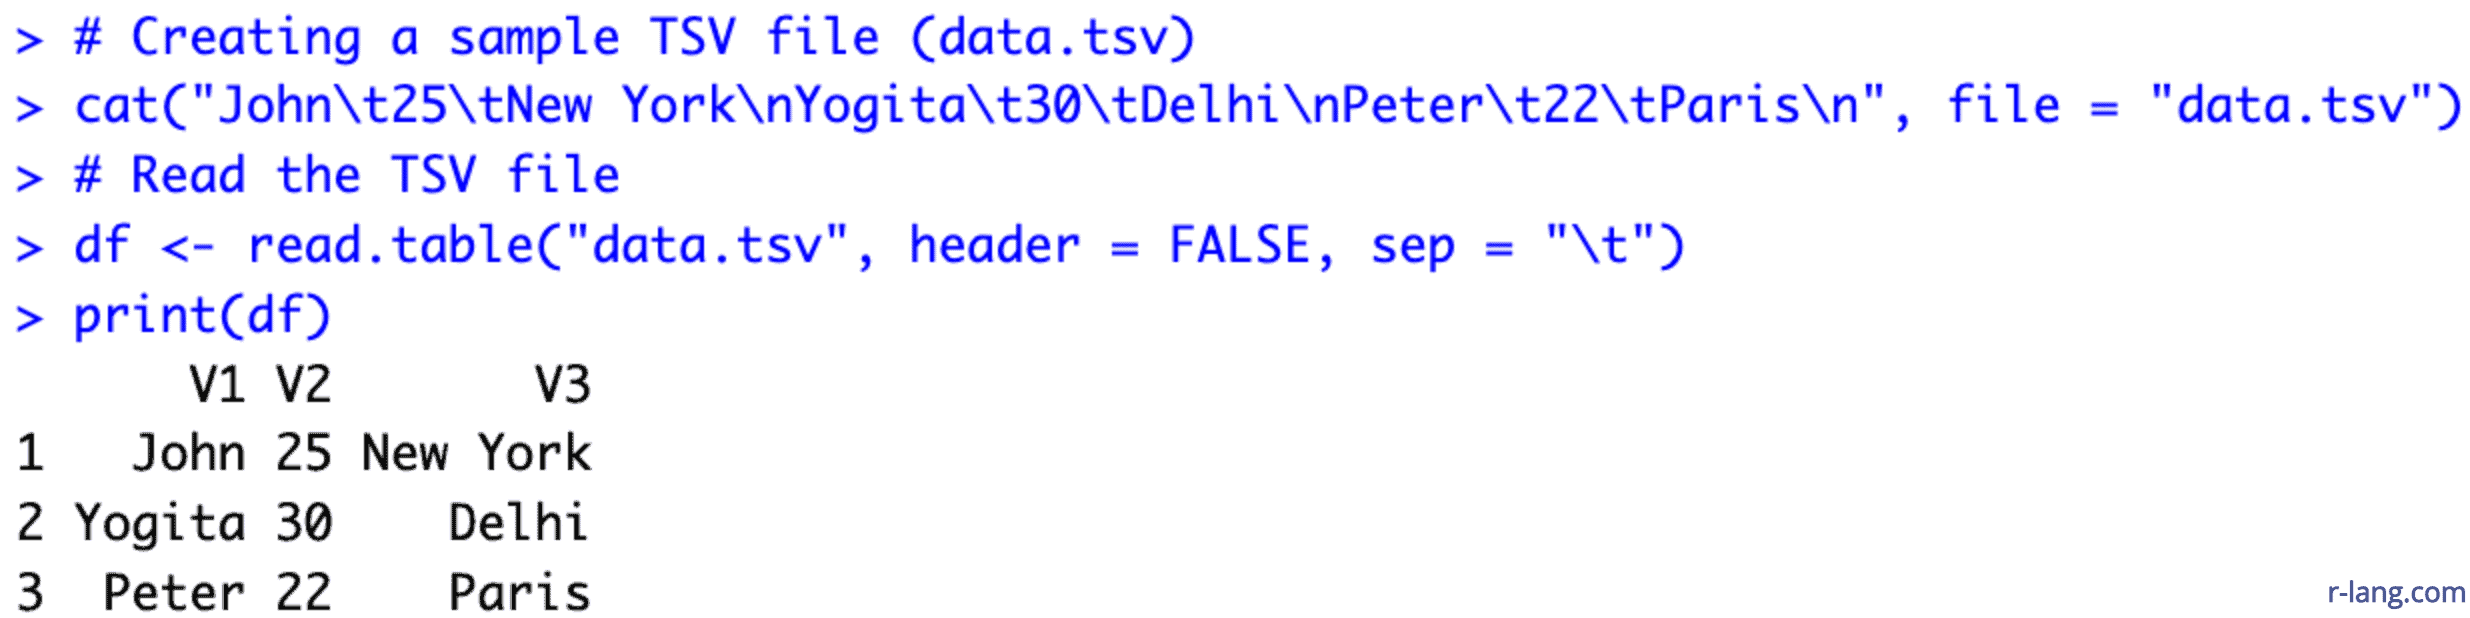
In this code, we created a TSV file on the fly and imported it using read.table() function and displayed it in RStudio by writing few lines of code.
You can see that we have not imported column names, and that’s why it assigns by default names: V1, V2, and V3. The sep = “\t” uses the tab character as the separator.
Specifying column classes
Let’s create a new CSV file on the fly that contains mixed data type columns. After importing it as a data frame, we will analyze its structure.
# Create a sample CSV file with mixed data types (data_types.csv)
cat("Name,Age,Salary,IsActive\nJohn,25,50000,TRUE\nJane,30,60000,FALSE\n", file = "data_types.csv")

# Read the CSV with specific column classes
data <- read.table("data_types.csv", header = TRUE, sep = ",",
                    colClasses = c("character", "numeric", "numeric", "logical"))

str(data) # Check the structure of the data frame
Output
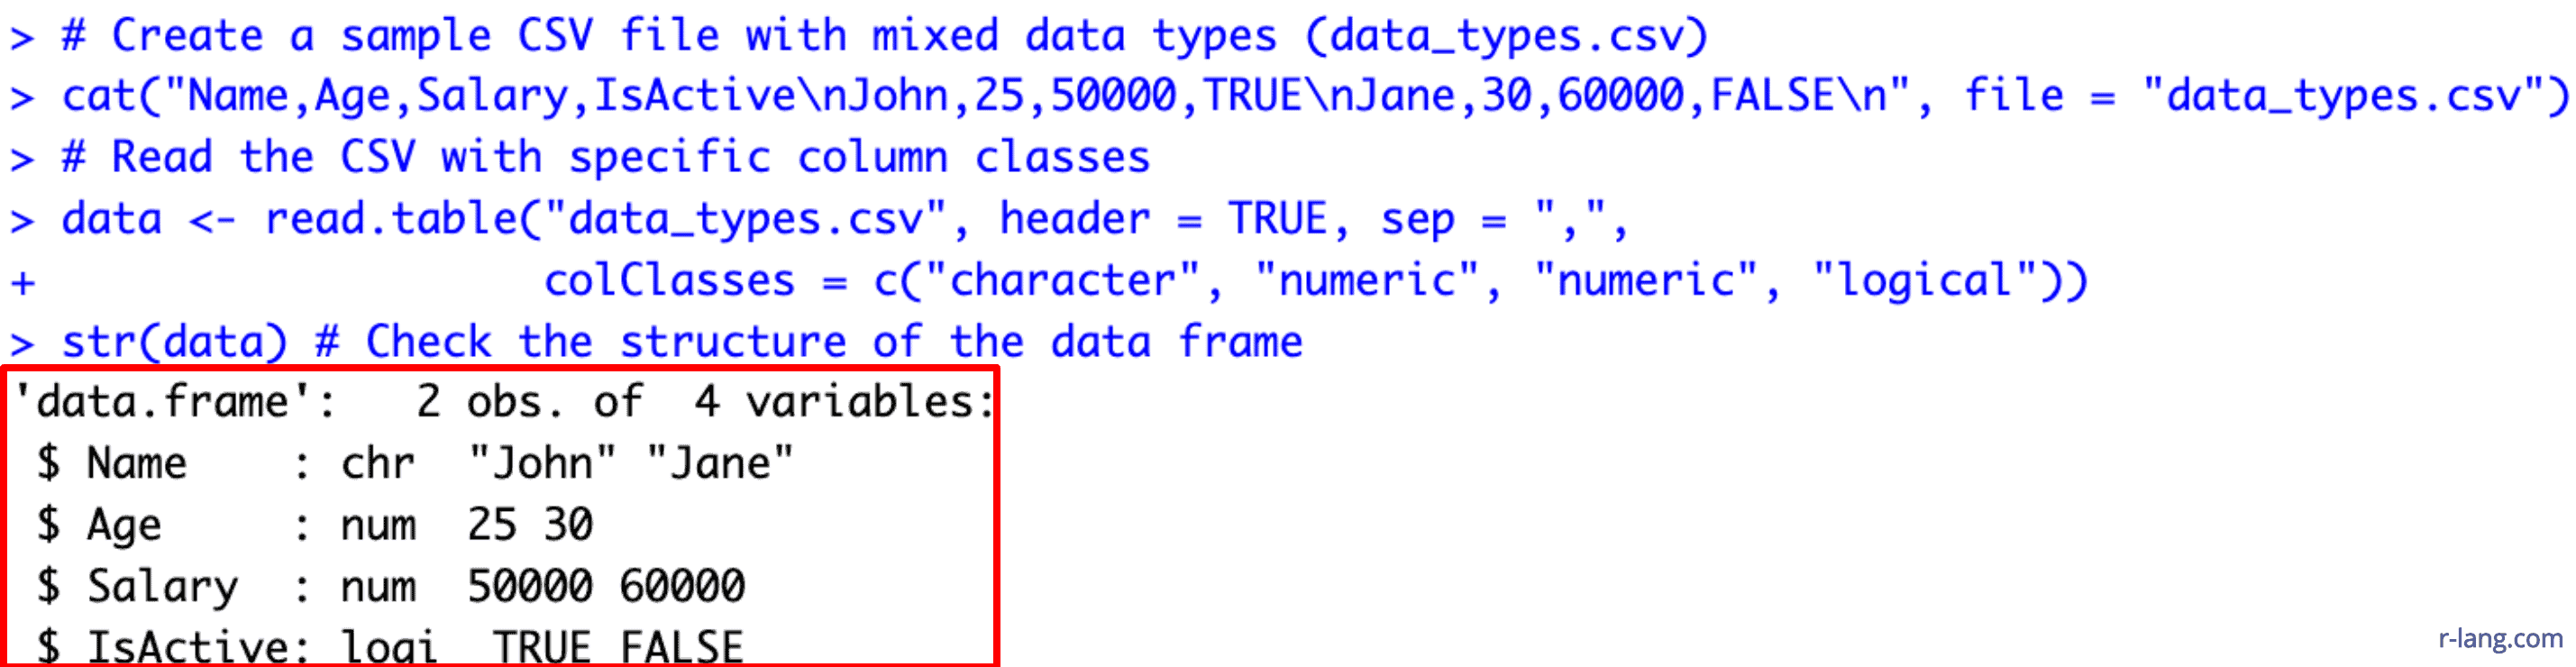
In the above programming code, you can see that we passed the “colClasses” argument, which is a vector specifying a data type for each column.
Handling Missing Values
If we want to replace missing values with NA in a final data frame, we need to pass na.strings = “” as an argument.
# Creating a sample CSV file with missing values (missing_data.csv)
cat("Name,Age,City\nJohn,25,\nJane,,London\nPeter,22,Paris\n", file = "missing_data.csv")

# Reading the CSV, specifying the missing value representation
df <- read.table("missing_data.csv", header = TRUE, sep = ",", na.strings = "") # na.strings = c("","NA","?") for multiple missing values

print(df)
Output
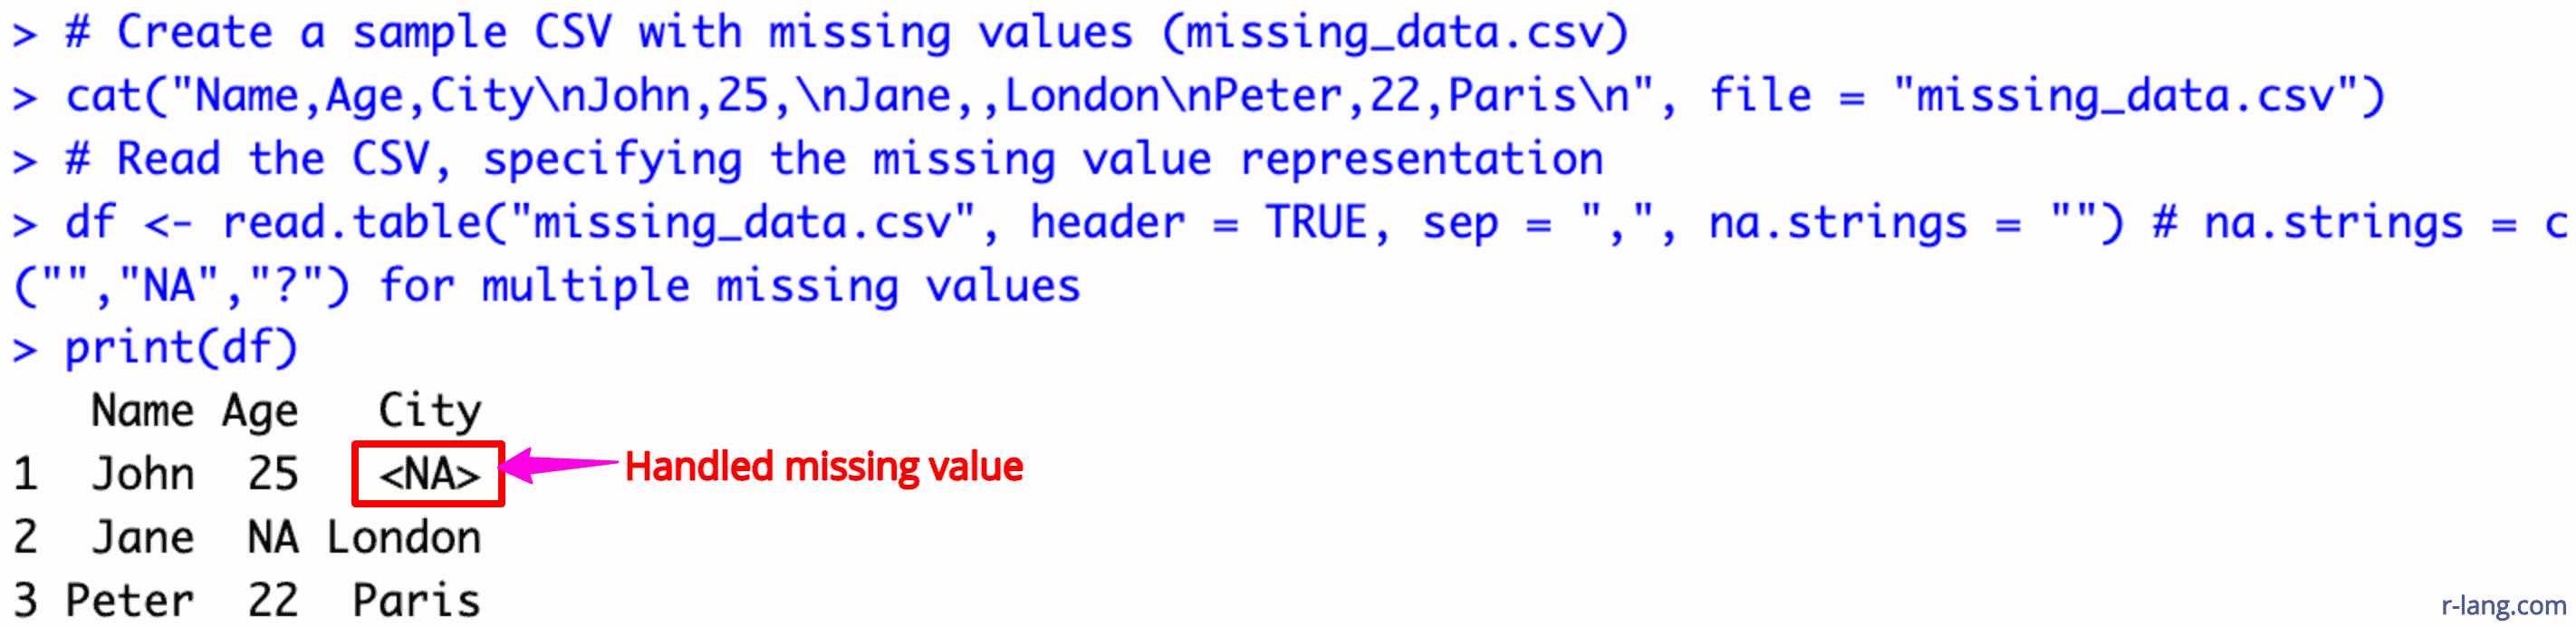
In the above code, we specified which string should be interpreted as missing value, and we told R that (“”) empty values should be treated as missing values, and hence, it was replaced with <NA> in the final data frame.
That’s all for today!

Krunal Lathiya is a seasoned Computer Science expert with over eight years in the tech industry. He boasts deep knowledge in Data Science and Machine Learning. Versed in Python, JavaScript, PHP, R, and Golang. Skilled in frameworks like Angular and React and platforms such as Node.js. His expertise spans both front-end and back-end development. His proficiency in the Python language stands as a testament to his versatility and commitment to the craft.