
The exp() is a built-in function that calculates the exponential of its input, raising Euler’s number e (approximately 2.718281828) to the power of the given value.
For example, e^y or the exponential of y. The value of e is approximately equal to 2.71828.
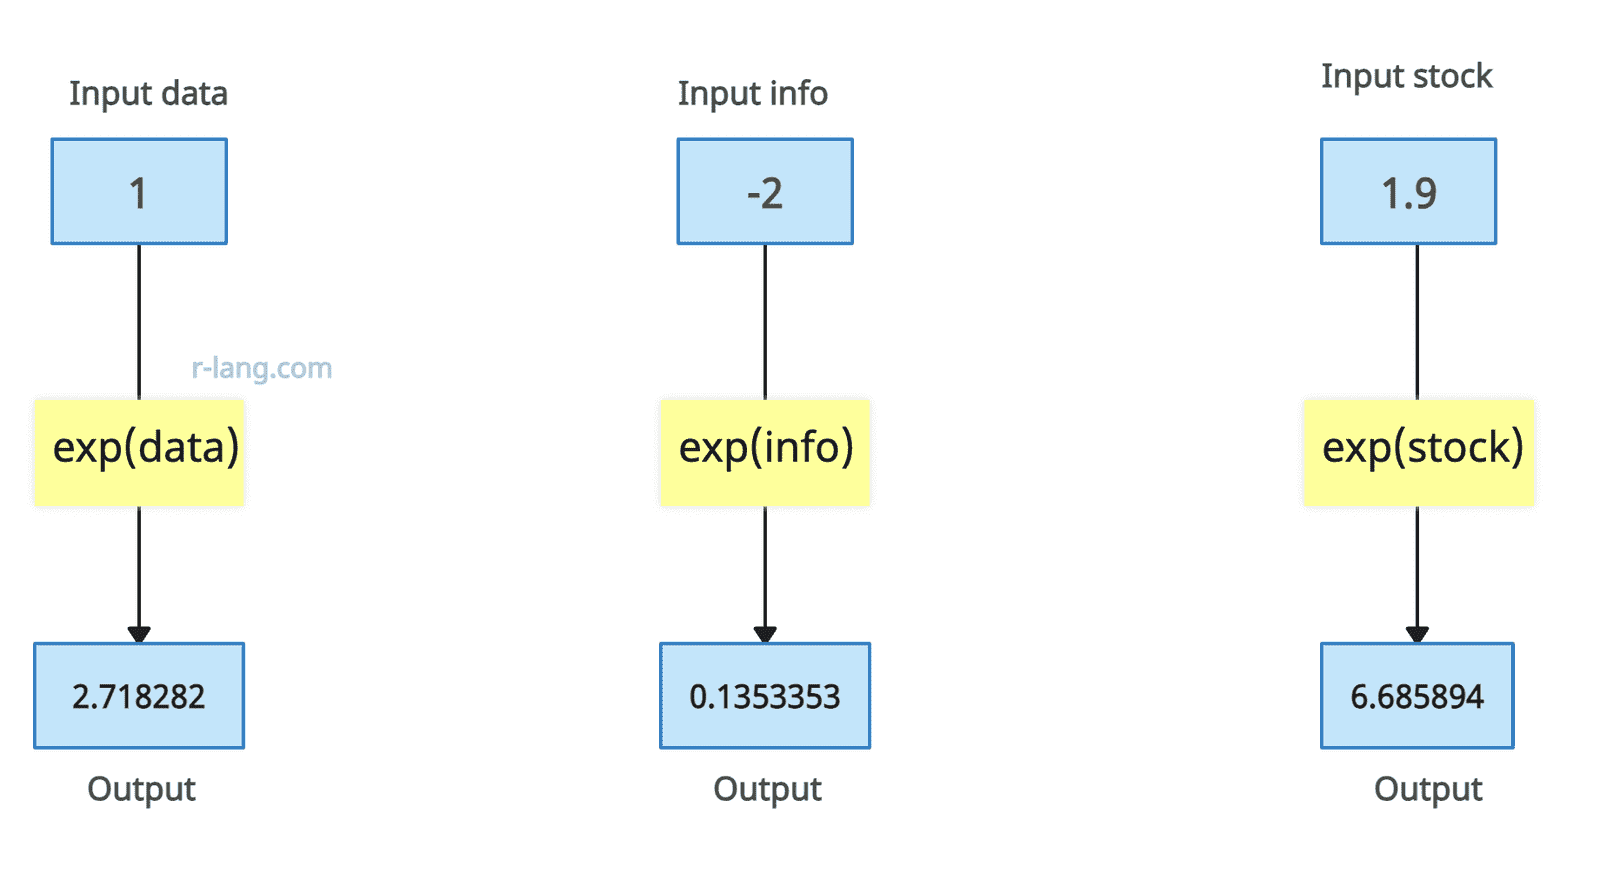
data <- 1
info <- -2
stock <- 1.9

exp(data)

# Output: [1] 2.718282

exp(info)

# Output: [1] 0.1353353

exp(stock)

# Output: [1] 6.685894
In this code, e^1 returns 2.718282.
Even if the input is -2, e^-2 returns a positive value 0.1353353
In the last case, the input is 1.9, e^1.9 returns a positive value 6.685894
Syntax
exp(x)Parameters
| Argument | Description |
| x (required) | It represents the input value to calculate the exponential.
It is a single value, whether it is a real or complex value. |
Exponential of a Vector
The exp() function is vectorized, meaning that if the input is a vector, the output will also be a vector, where each value is the exponential value of the corresponding input value.
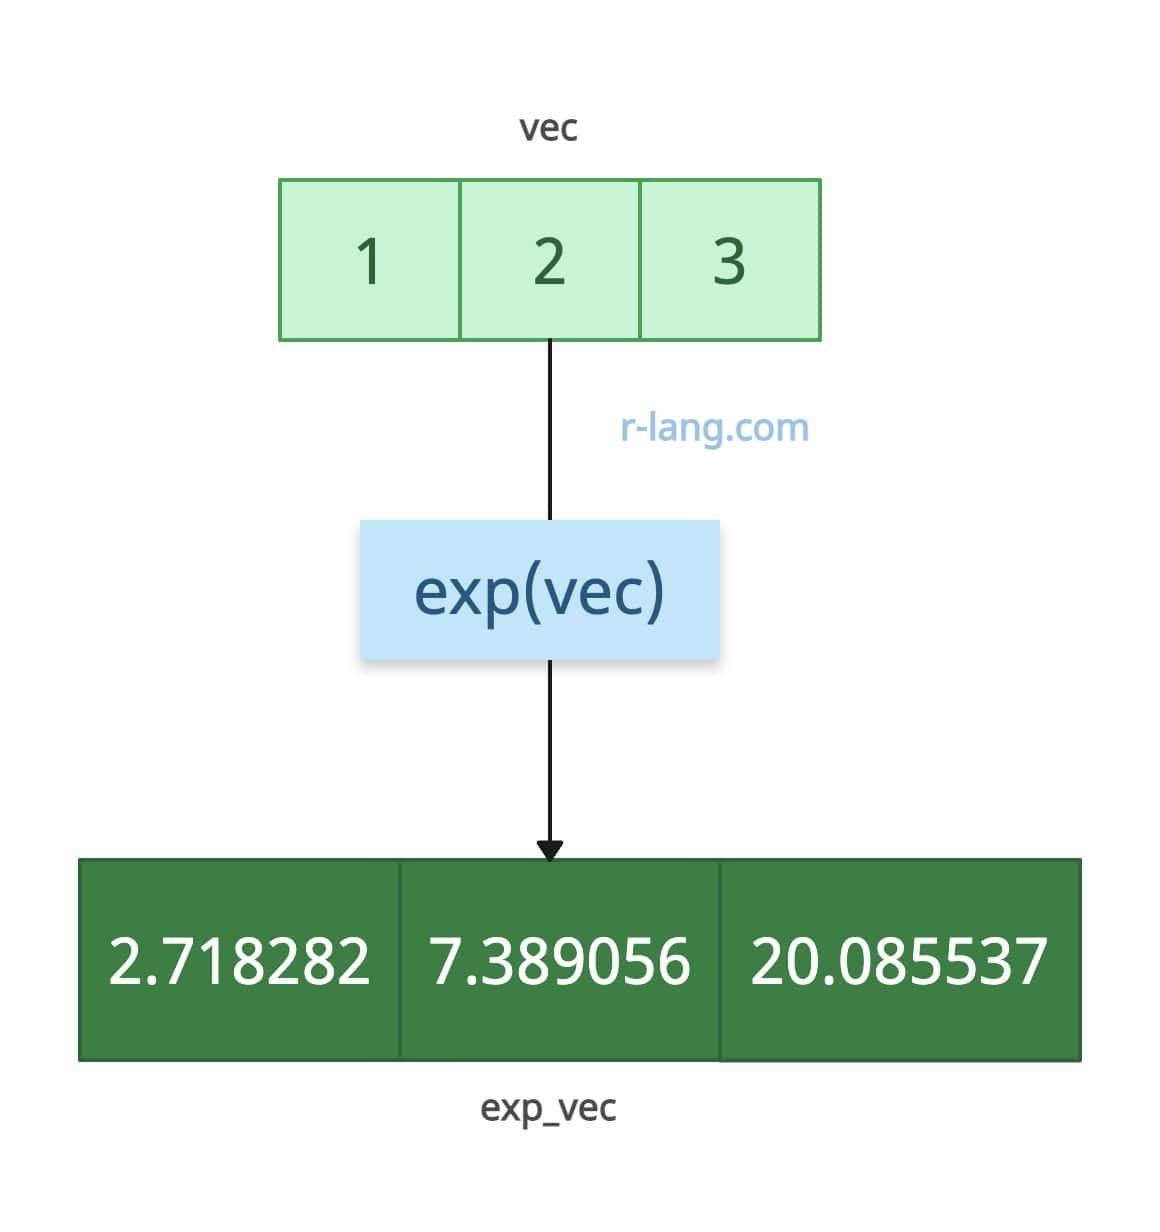
# Create a vector of numbers
vec <- c(1, 2, 3)

# Calculate the exponential of each element in the vector
exp_vec <- exp(vec)

# Print the results
print(exp_vec)

# Output: [1] 2.718282  7.389056  20.085537
Exponential of a data frame
When it comes to a data frame, each column is a vector. So, you need to pass a specific column to the exp() function that will return the exponential value of that column.
For selecting a specific column, you can use the $ operator.
df <- data.frame(
  col1 = c(1, 2, 3),
  col2 = c(4, 5, 6),
  col3 = c(7, 8, 9)
)

# Calculate exponential of the 'col2' column
df$col2_values <- exp(df$col2)

# Print the data frame
print(df)

# Output:
#    col1  col2  col3   col2_values
# 1   1     4     7      54.59815
# 2   2     5     8      148.41316
# 3   3     6     9      403.42879
Matrix Input
If the input is a matrix, let’s say a 2×2 matrix, the output will also be a 2×2 matrix.
mat <- matrix(c(0, 1, -1, 2), nrow = 2)
exp(mat)

# Output:
#         [,1]           [,2]
# [1,]     1           0.3678794
# [2,]     2.718282    7.389056
Exponential value of pi
The value of pi is 3.141593.
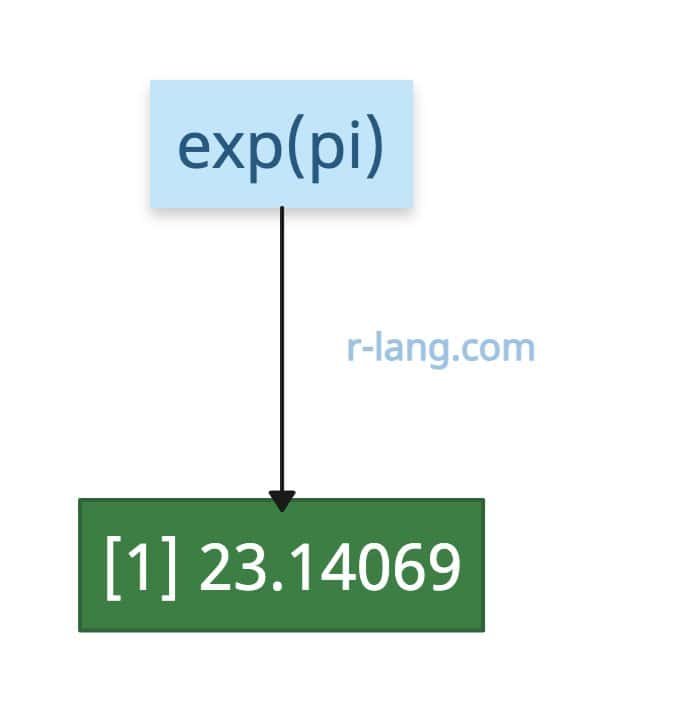
exp(pi)
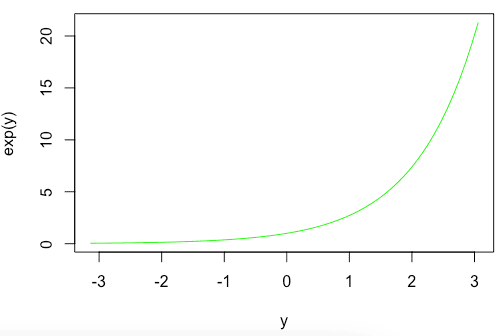
# Output: [1] 23.14069Let’s plot the line chart from -pi to +pi.
y <- seq(-pi, pi, by = 0.1)

plot(y, exp(y), typ = "l", col = "green")
Output
Plotting the exponential value in the range of -4 ~ +4
y <- seq(-4, 4, by = 0.1)
plot(y, exp(y), typ = "l", col = "green")
Output
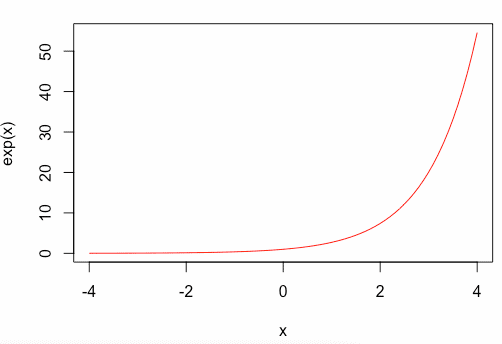
You can see that the value and the exponent growth increase exponentially in the line chart.
Combining with rounding
The exp() method returns a float value, and if you want to round the numbers, you can use the round() method for the formatted output.
expo <- exp(c(1, 2))

rounded_expo <- round(expo, 2)

print(rounded_expo)

# Output: [1] 2.72   7.39
Edge cases
What if the input value is 0, inf, -inf, or NaN? What should be the output? Let’s find out.
exp(0)

# Output: 1

exp(Inf)

# Output: Inf

exp(-Inf)

# Output: 0

exp(NaN)

# Output: NaN
The exponential of 0 is 1, Infinity is Inf, -Infinity is -Inf, and NaN is NaN.

Krunal Lathiya is a seasoned Computer Science expert with over eight years in the tech industry. He boasts deep knowledge in Data Science and Machine Learning. Versed in Python, JavaScript, PHP, R, and Golang. Skilled in frameworks like Angular and React and platforms such as Node.js. His expertise spans both front-end and back-end development. His proficiency in the Python language stands as a testament to his versatility and commitment to the craft.