
The dplyr summarise()(or summarize()) function aggregates data into a single summary value for each group or the entire dataset if ungrouped.
It collapses multiple rows into a concise statistical summary, such as the mean, sum, and count.
Developers often use summarize() with group_by(), which splits the data into groups based on one or more categorical variables (Columns you can use for groupings).
They then apply the summary function(s), such as mean and sum, to each group separately to create a comprehensive summary that makes sense.
The resulting data frame (tibble) has a single row or row for each group, with the summary statistic(s) for the entire data frame or for that group.
Syntax
summarise(.data, .by = NULL, .groups = NULL)

# OR

summarize(.data, .by = NULL, .groups = NULL, ...)
Parameters
| Name | Value |
| .data | It is an input data frame, tibble, or other dataset type. |
| .by | It suggests grouping things before performing operations like mean, sum, count, etc. |
| .groups | It determines how to maintain groups after operating on them. |
| … | It tells whether you want to count or summarise. |
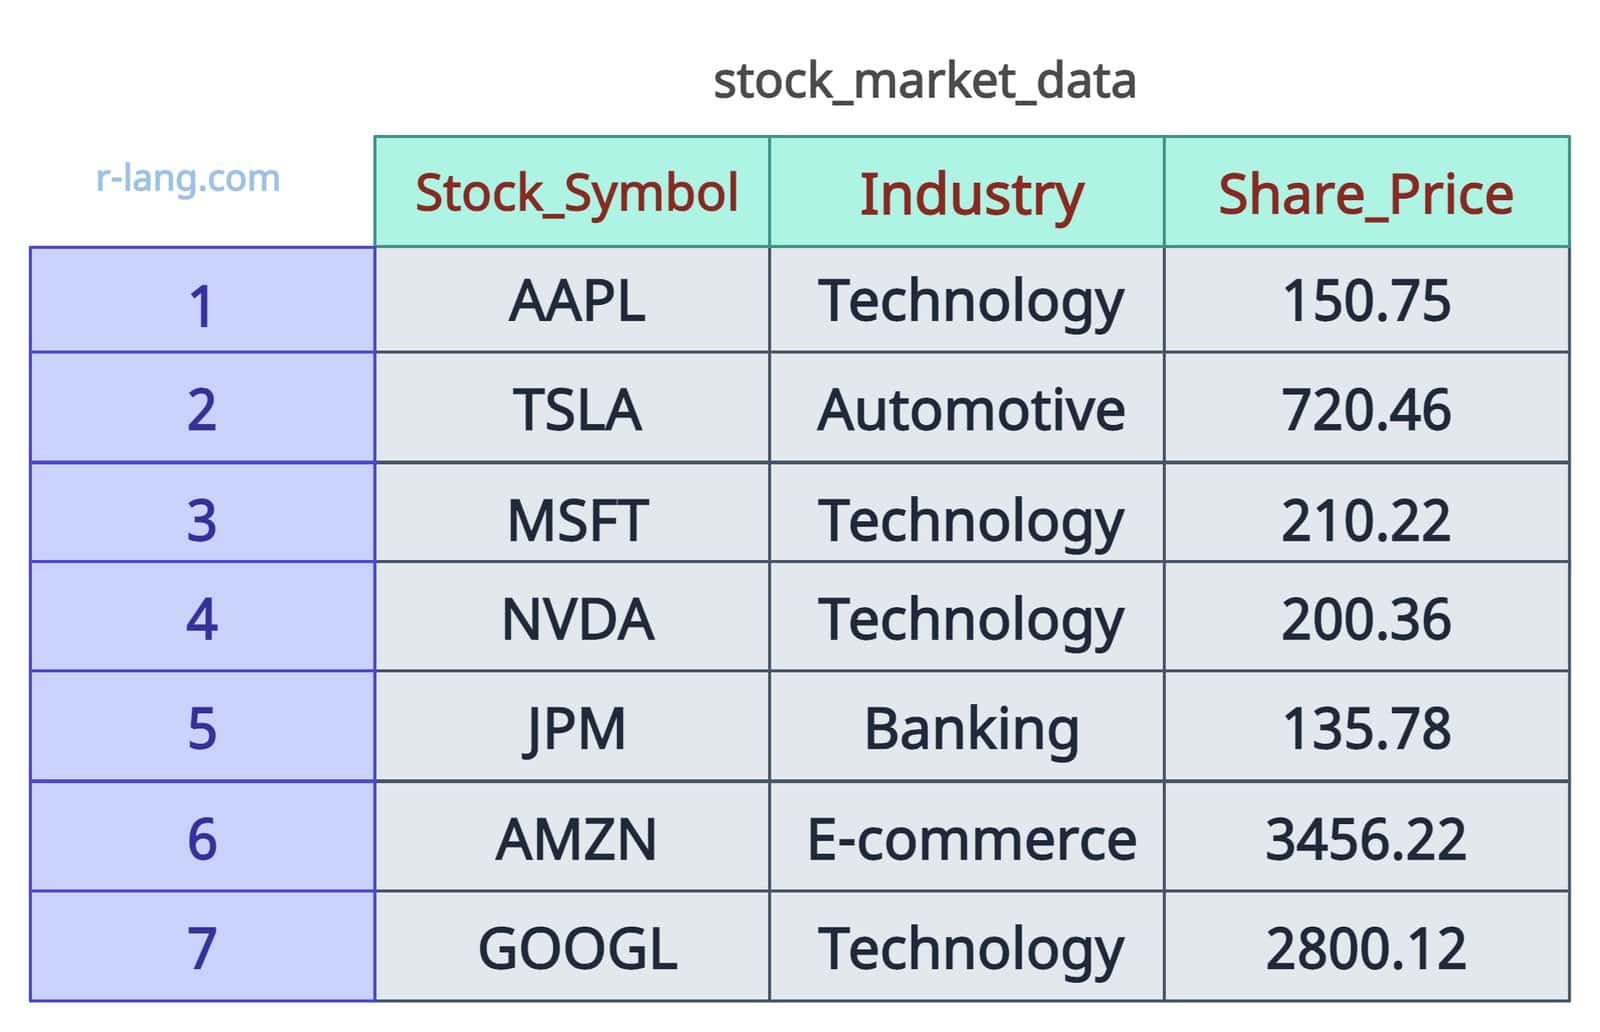
Example data frame
We will use the stock_market_data data frame.
library(dplyr)

stock_market_data <- data.frame(
  Stock_Symbol = c("AAPL", "TSLA", "MSFT", "NVDA", "JPM", "AMZN", "GOOGL"),
  Industry = c(
    "Technology", "Automotive", "Technology",
    "Technology", "Banking", "E-commerce", "Technology"
  ),
  Share_Price = c(150.75, 720.46, 210.22, 200.36, 135.78, 3456.22, 2800.12)
)

print(stock_market_data)
Basic summary of the data frame
We can calculate the basic summary of the column Share_Price of the data frame by calculating the mean of that column without any type of grouping.
library(dplyr)

stock_market_data <- data.frame(
  Stock_Symbol = c("AAPL", "TSLA", "MSFT", "NVDA", "JPM", "AMZN", "GOOGL"),
  Industry = c(
    "Technology", "Automotive", "Technology",
    "Technology", "Banking", "E-commerce", "Technology"
  ),
  Share_Price = c(150.75, 720.46, 210.22, 200.36, 135.78, 3456.22, 2800.12)
)


print(stock_market_data)
Output
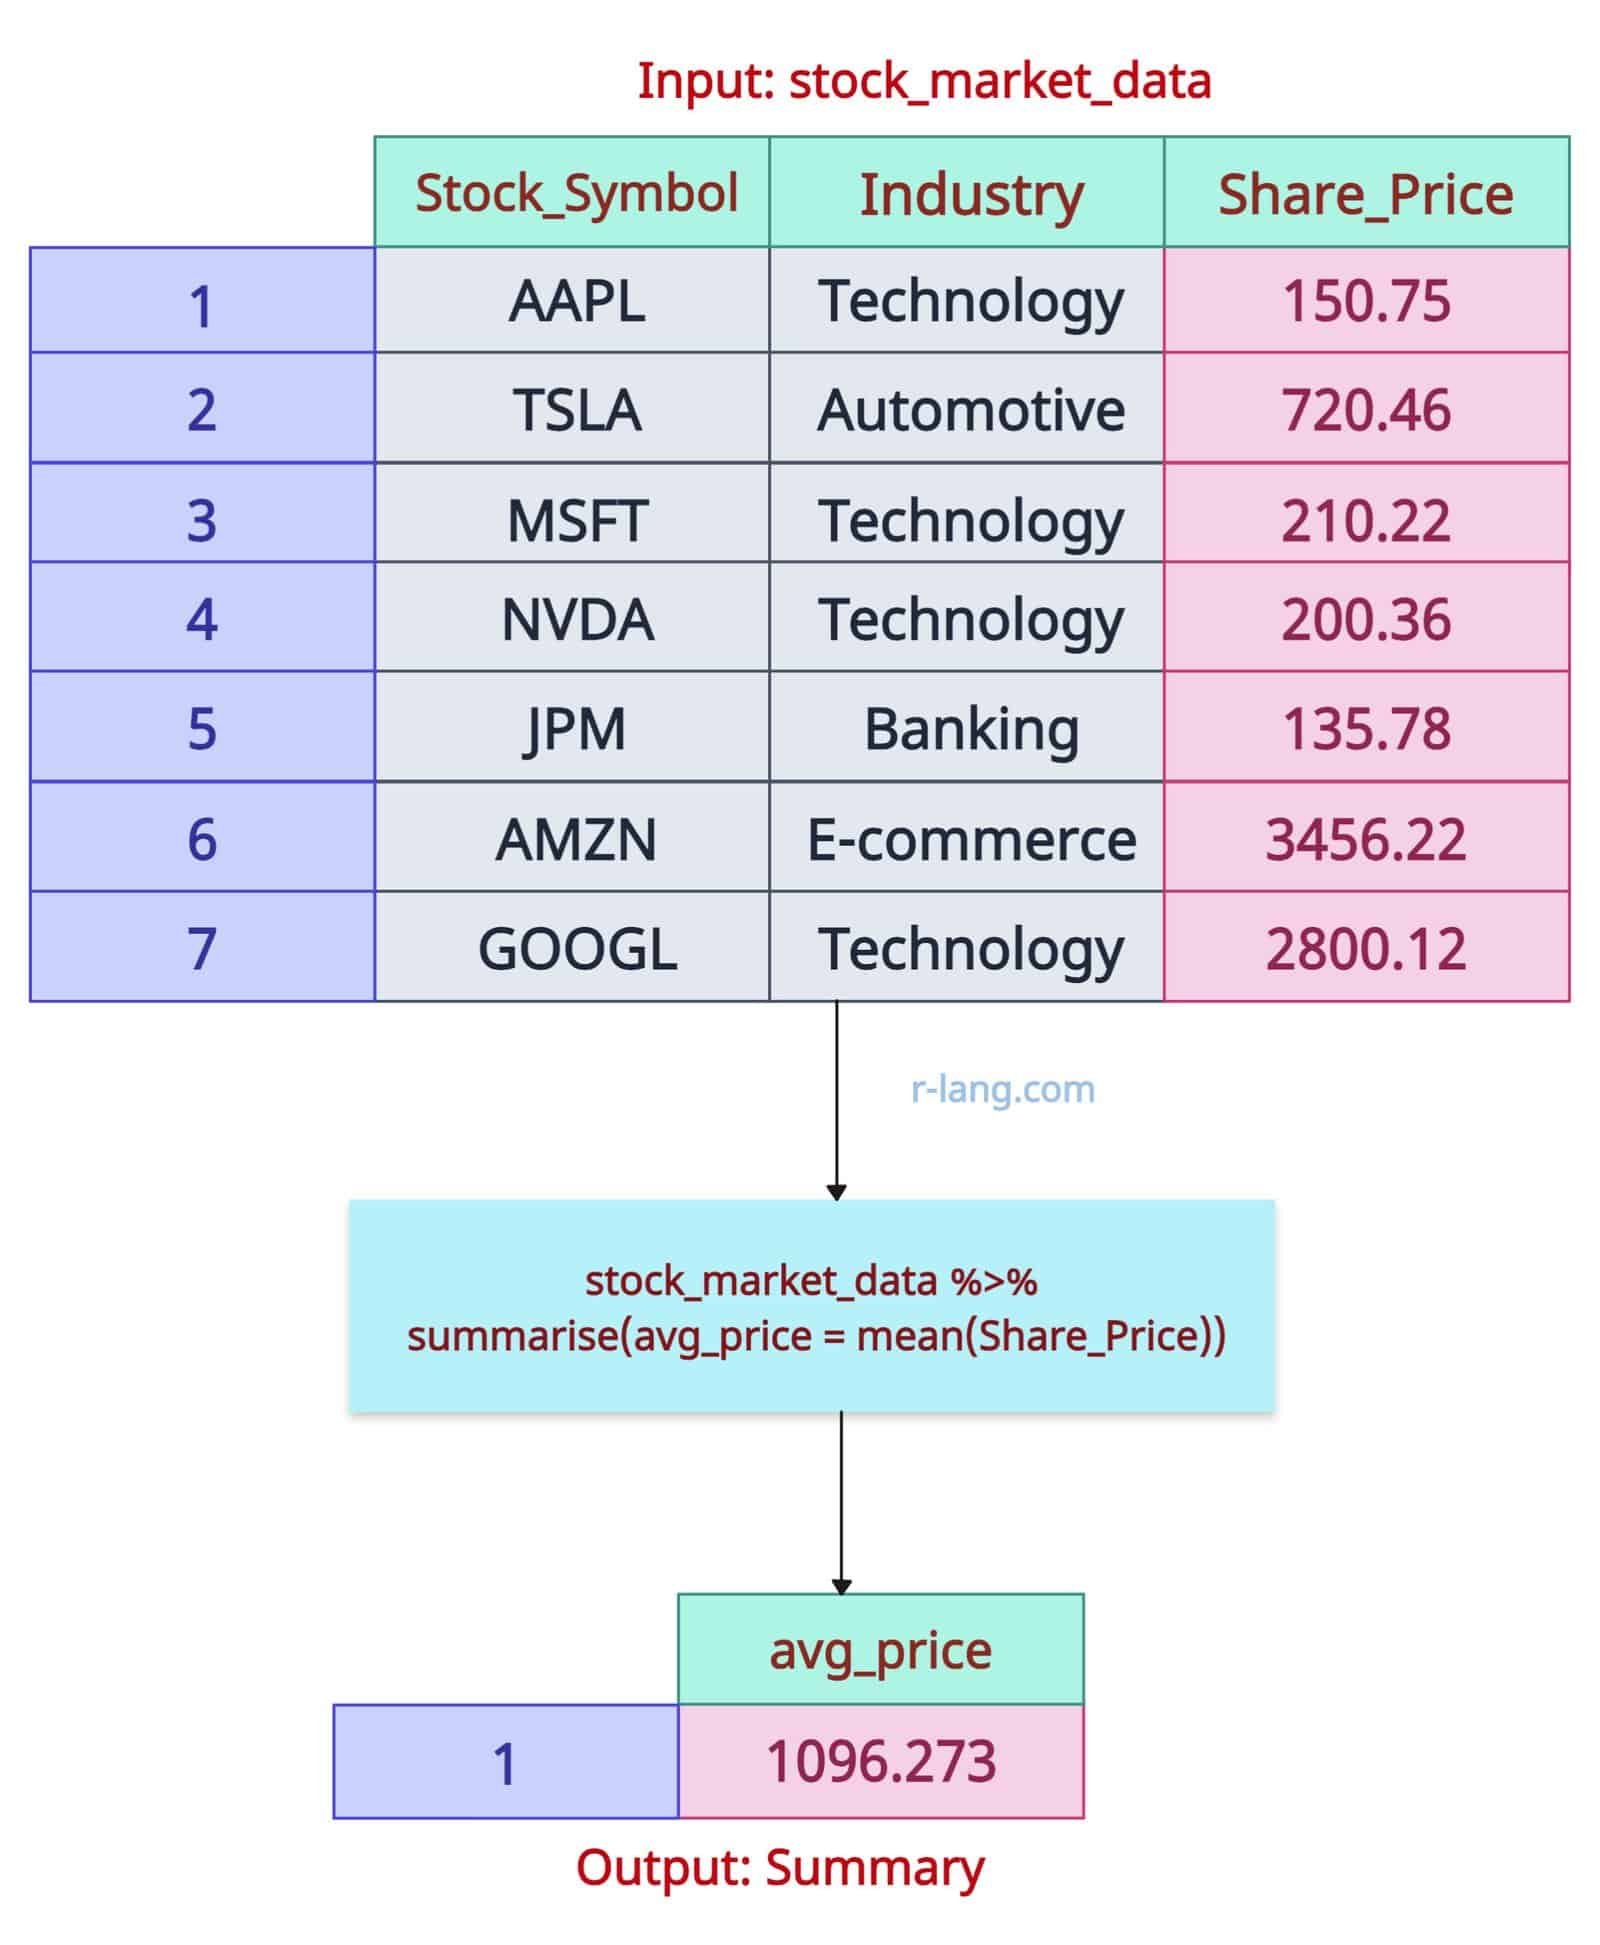
The above output figure illustrates that we utilized the aggregate function mean() for the Share_Price column to calculate the average price for the entire data frame.
You can analyze the data as follows: To buy at least one share of any company, you must have a minimum balance of $1,096.27 in your bank account.
Grouped summary
Summary without a group is like counting your candy without sorting your flavors.
Let’s calculate the average share price by industry:
library(dplyr)

stock_market_data <- data.frame(
  Stock_Symbol = c("AAPL", "TSLA", "MSFT", "NVDA", "JPM", "AMZN", "GOOGL"),
  Industry = c(
    "Technology", "Automotive", "Technology",
    "Technology", "Banking", "E-commerce", "Technology"
  ),
  Share_Price = c(150.75, 720.46, 210.22, 200.36, 135.78, 3456.22, 2800.12)
)


print(stock_market_data)

# Grouped Summary
stock_market_data %>%
  group_by(Industry) %>%
  summarise(avg_price = mean(Share_Price))
Output
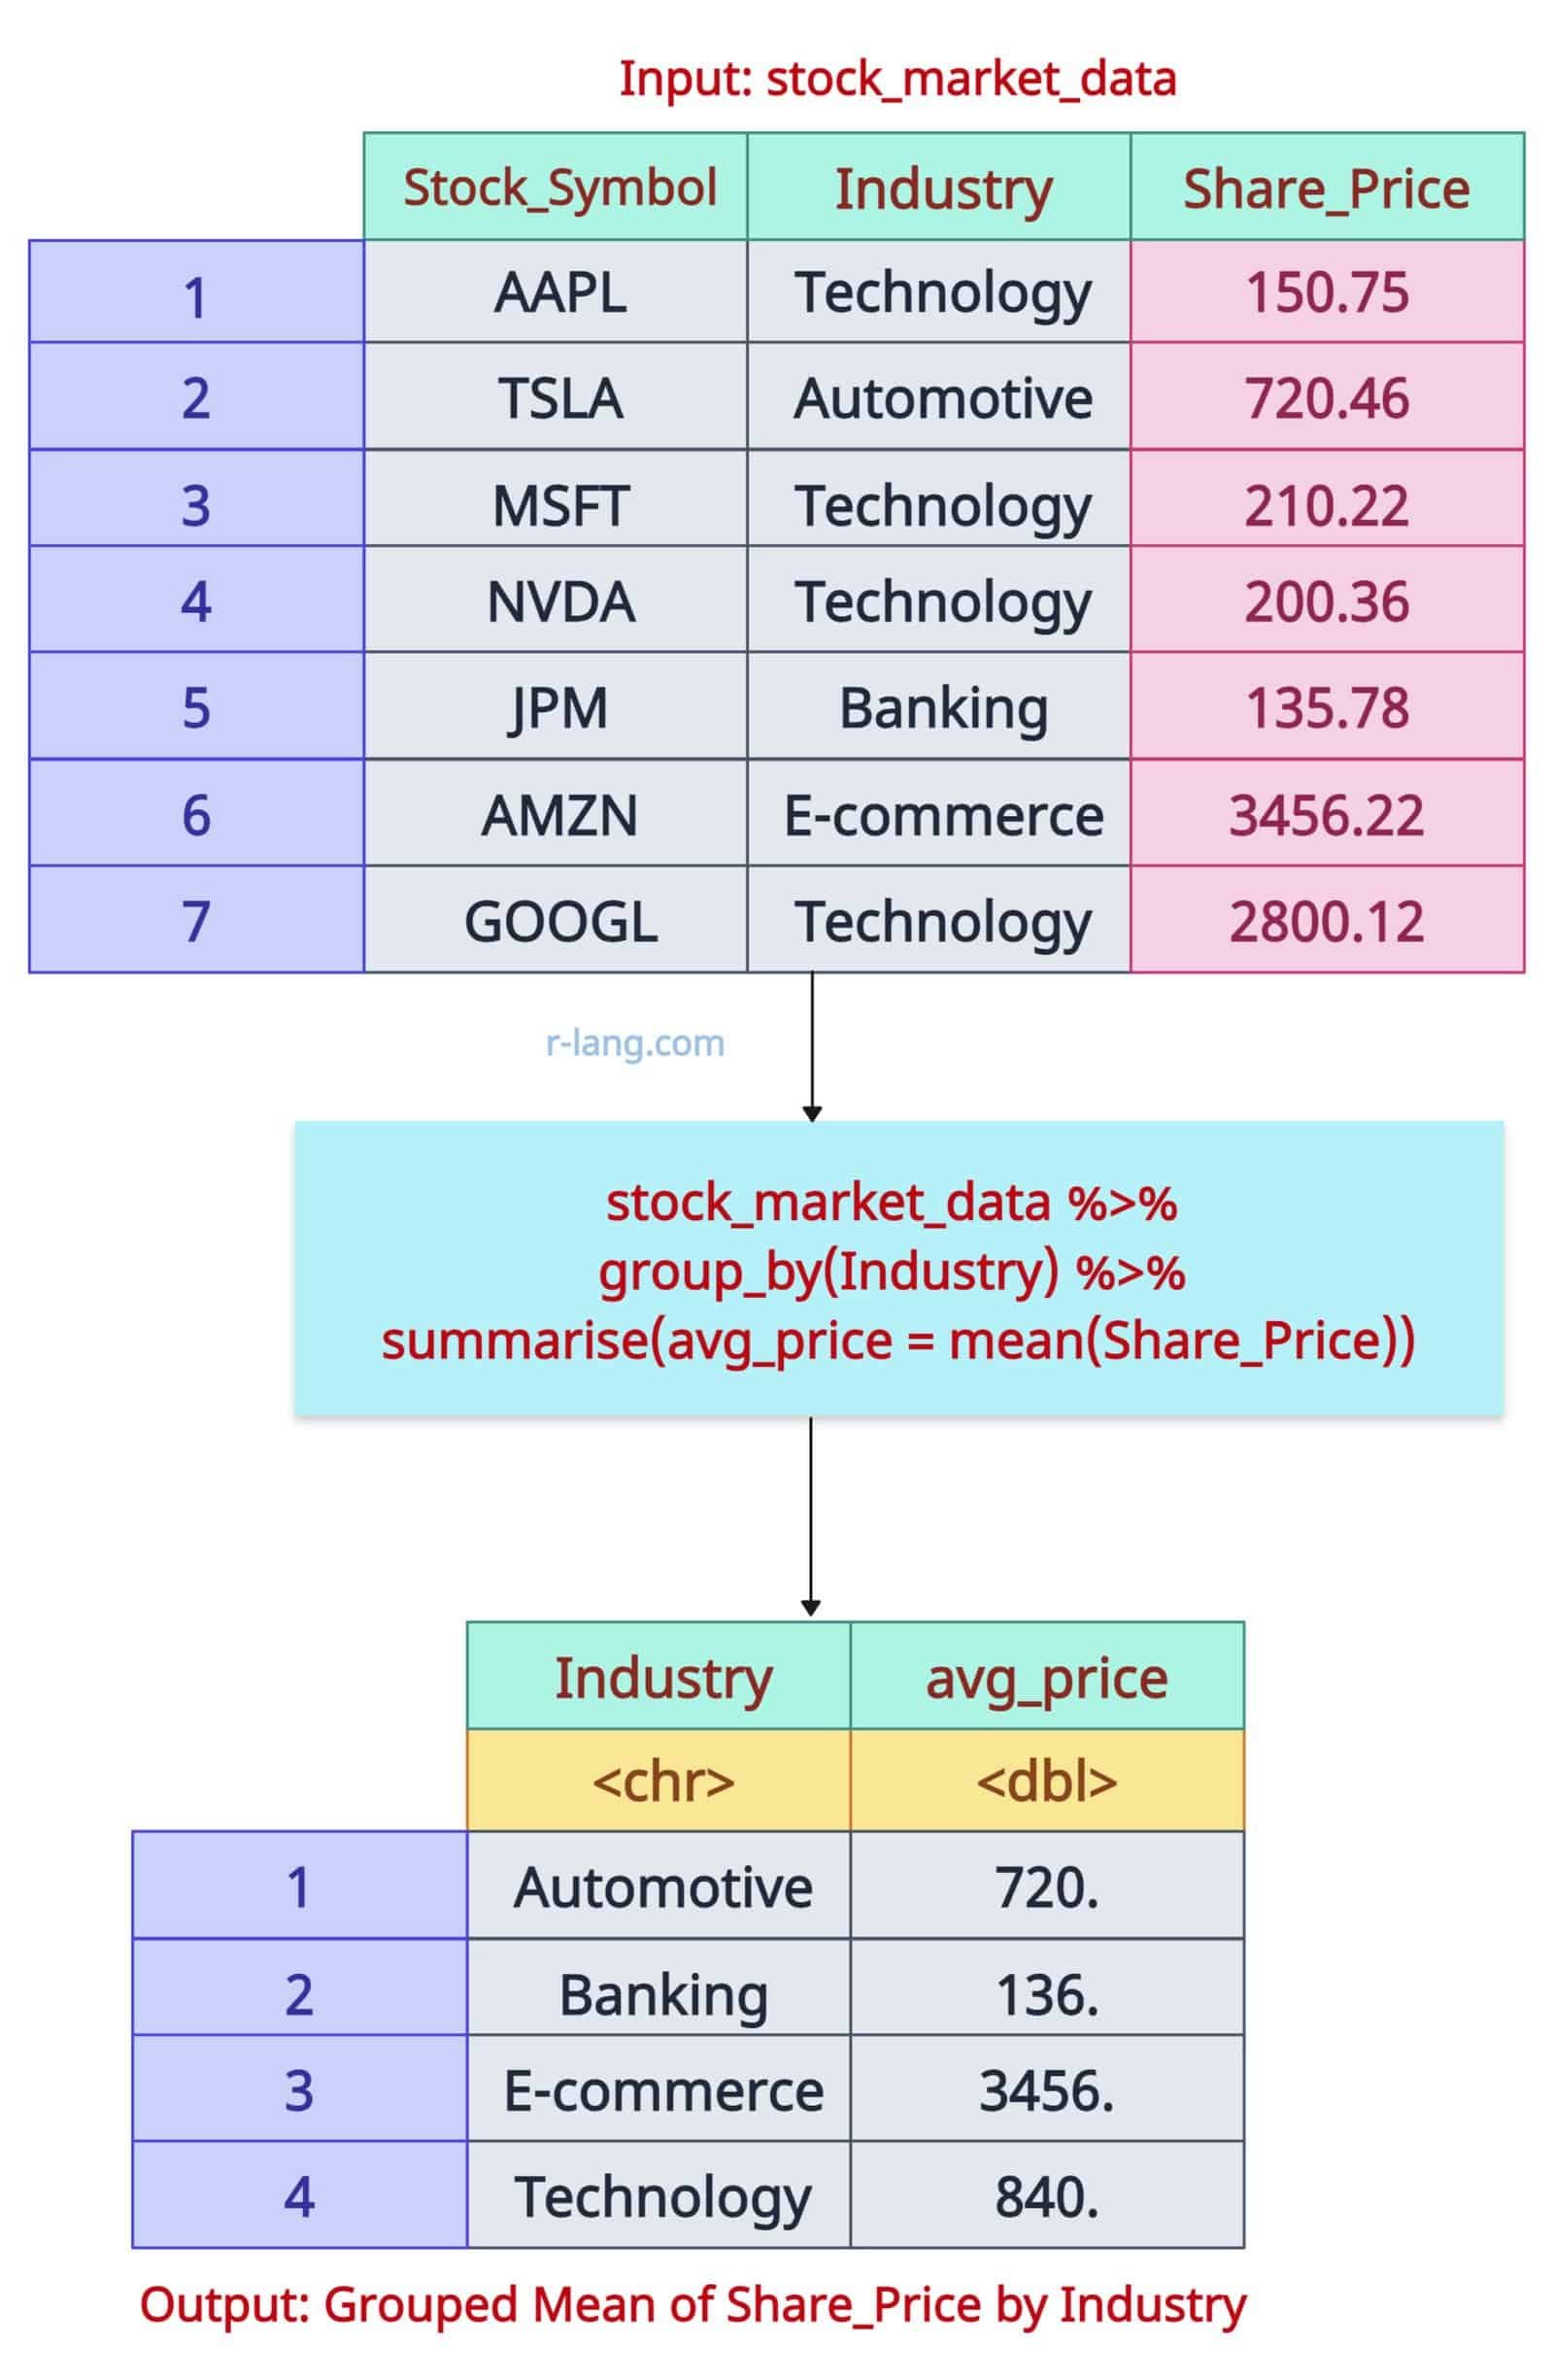
The above figure shows the average Share_Price for each Industry. The output is a 4X2 tibble, as you can see.
Multiple summaries
Multiple summaries indicate that you are calculating the average and maximum share prices for the data frame, grouped by industry.
library(dplyr)

stock_market_data <- data.frame(
  Stock_Symbol = c("AAPL", "TSLA", "MSFT", "NVDA", "JPM", "AMZN", "GOOGL"),
  Industry = c(
    "Technology", "Automotive", "Technology",
    "Technology", "Banking", "E-commerce", "Technology"
  ),
  Share_Price = c(150.75, 720.46, 210.22, 200.36, 135.78, 3456.22, 2800.12)
)


print(stock_market_data)


# Multiple Summaries
stock_market_data %>%
  group_by(Industry) %>%
    summarise(
      avg_price = mean(Share_Price),
      min_price = min(Share_Price),
      max_price = max(Share_Price)
  )
Output
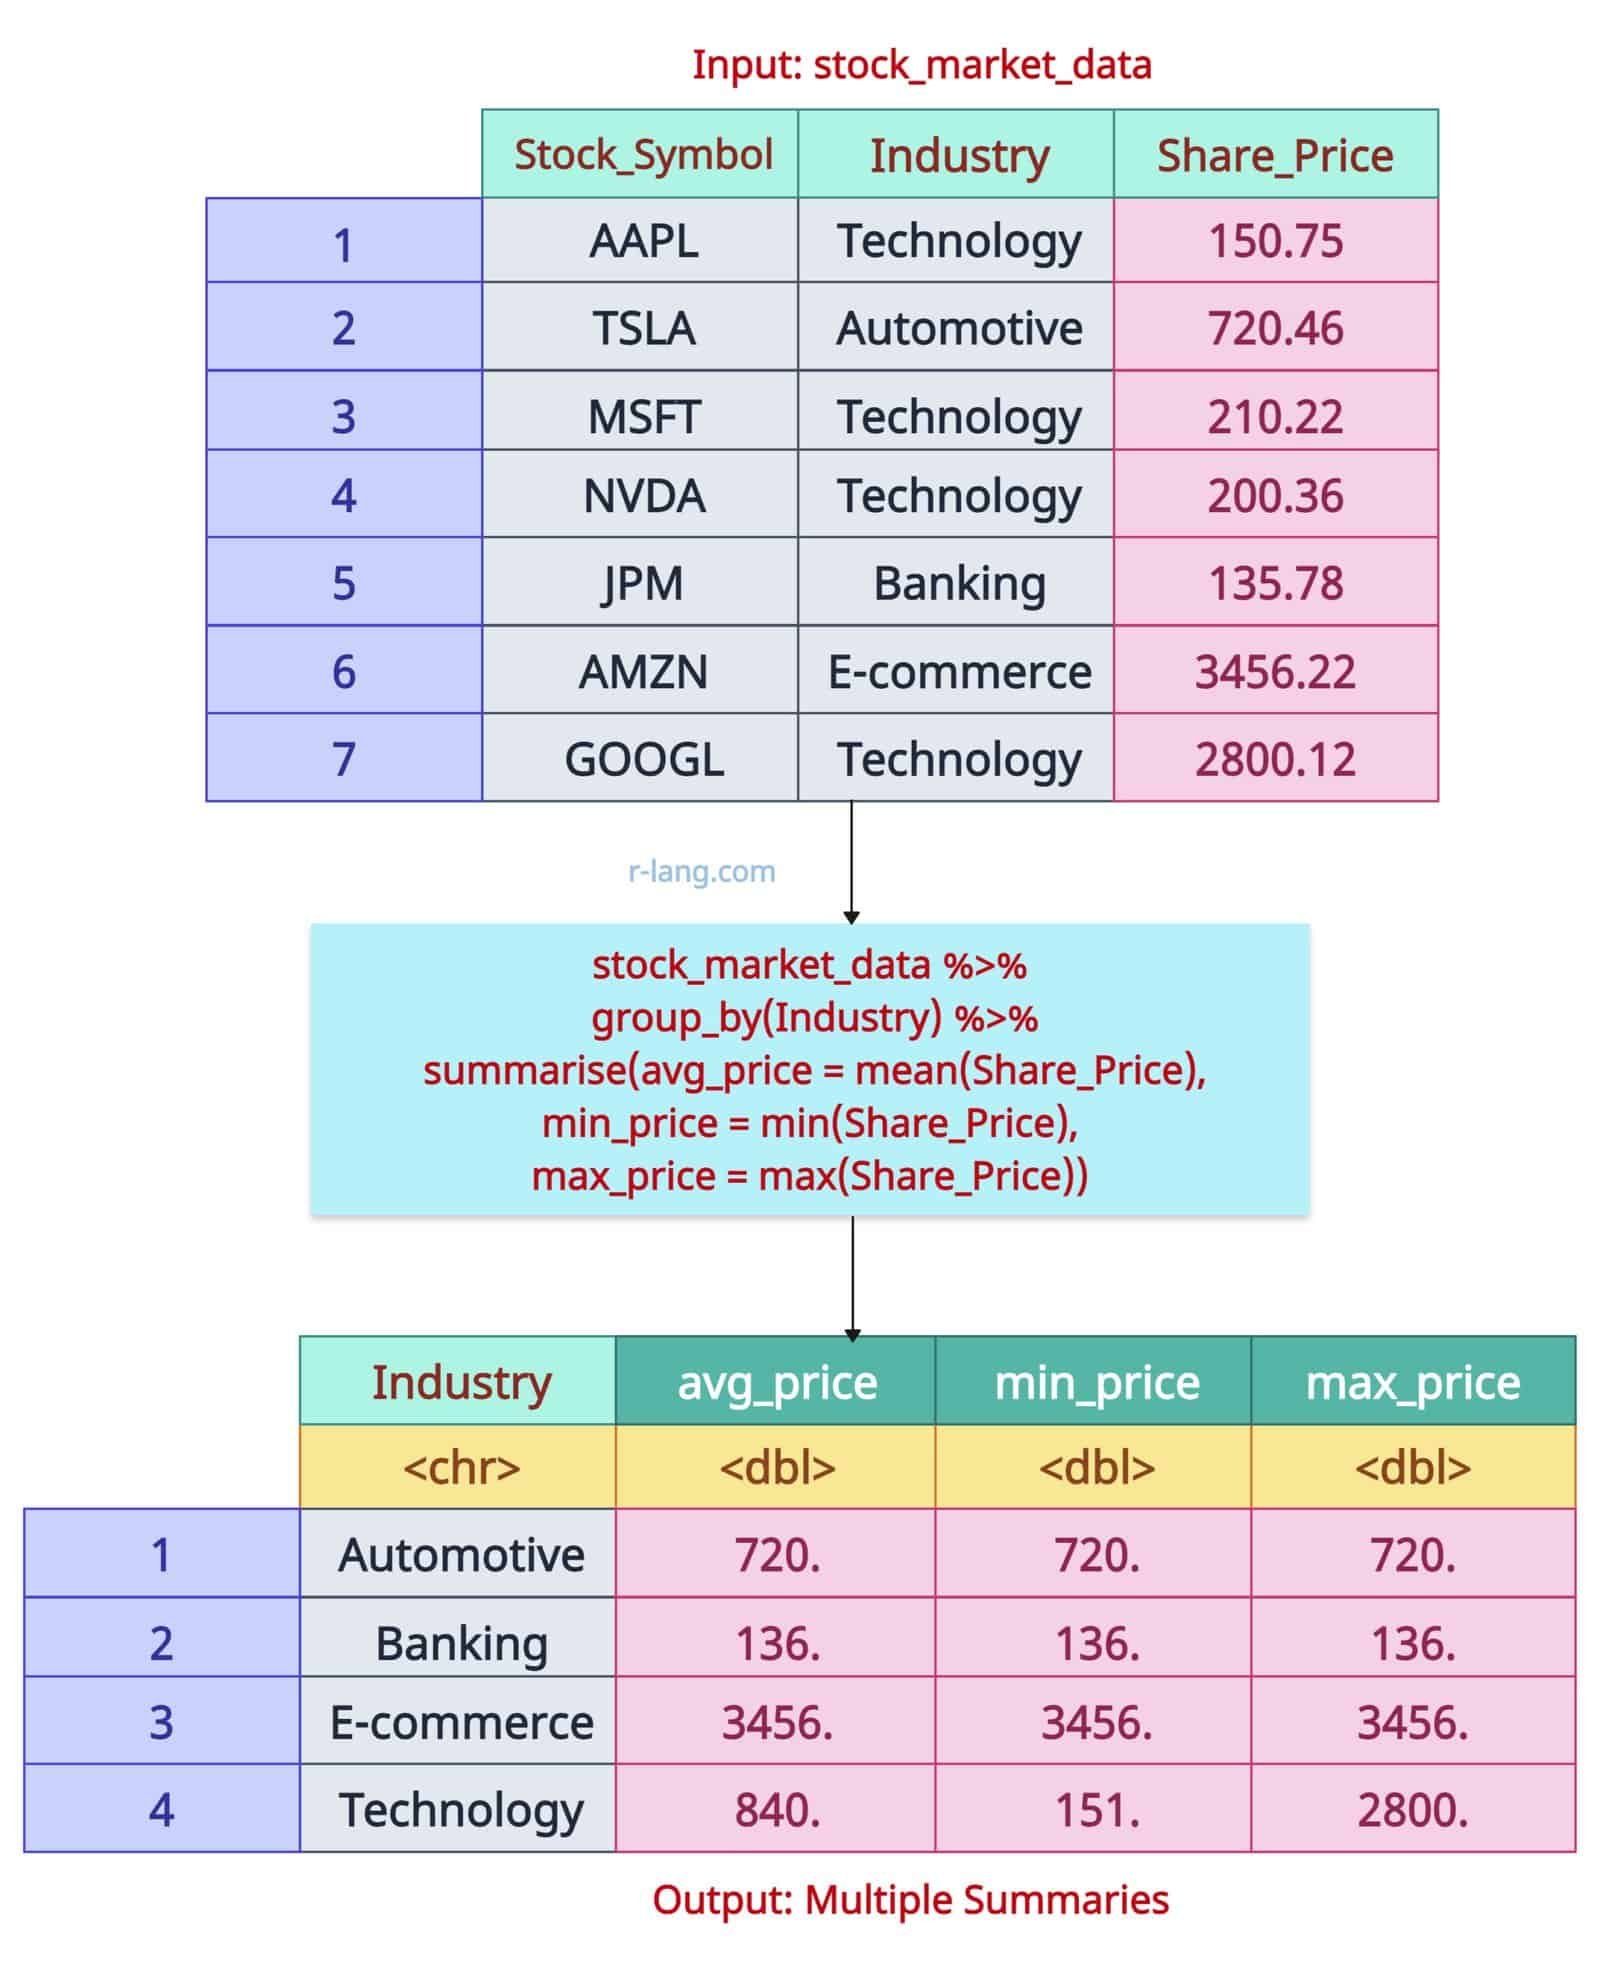 In this code, we calculated the average, minimum, and maximum share price (multiple summaries) of Stocks based on Industry. The output is a 4X4 tibble, as you can see.
summarise(across()) with Multiple Columns
The dplyr::across() function allows us to apply multiple summary functions to multiple columns simultaneously.
It is helpful when we want to calculate min, max, count, and mean for multiple columns using the dplyr::summarise() function.
library(dplyr)

stock_market_data <- data.frame(
  Stock_Symbol = c("AAPL", "TSLA", "MSFT", "NVDA", "JPM", "AMZN", "GOOGL"),
  Industry = c(
    "Technology", "Automotive", "Technology",
    "Technology", "Banking", "E-commerce", "Technology"
  ),
  Share_Price = c(150.75, 720.46, 210.22, 200.36, 135.78, 3456.22, 2800.12)
)


print(stock_market_data)


# Summarize across multiple columns with multiple functions
stock_market_data %>%
  summarise(
    across(
      Share_Price, # Column to summarize
      list(mean = mean, max = max), # Functions to apply
      .names = "{col}_{fn}" # Custom naming for output columns
    ),
    unique_industries = n_distinct(Industry) # Additional summary
 )
Output
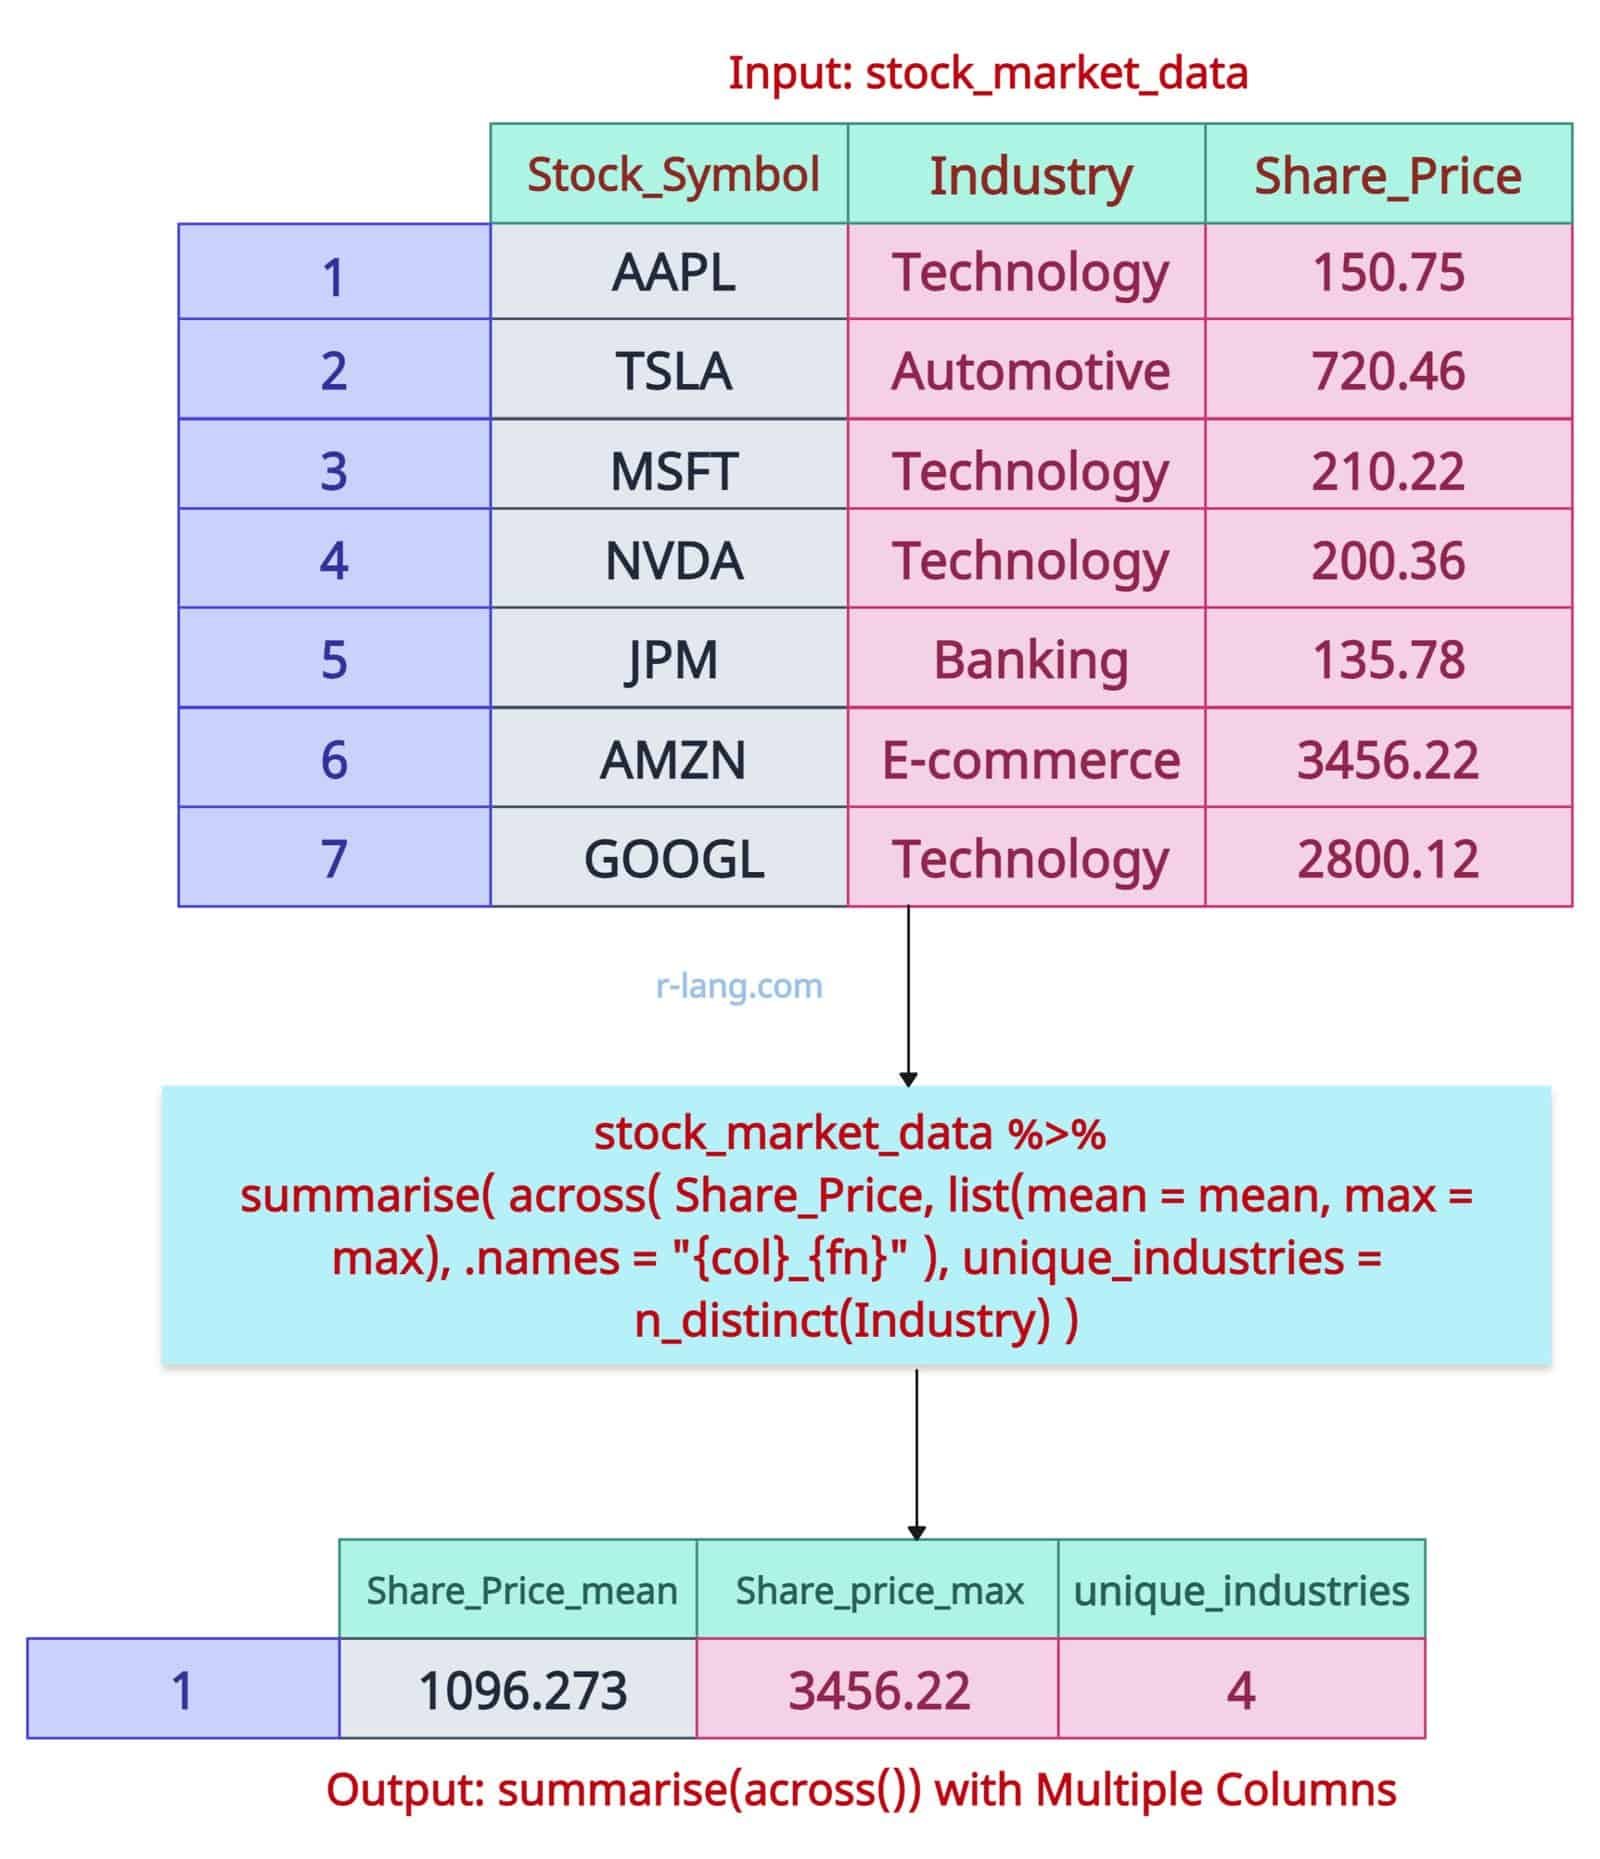
In this code example, we counted the number of unique industries in our data frame.
We also calculated the mean share price and the max share price from the data frame.
We applied multiple aggregate functions to multiple columns to obtain a summary of the data frame.

Krunal Lathiya is a seasoned Computer Science expert with over eight years in the tech industry. He boasts deep knowledge in Data Science and Machine Learning. Versed in Python, JavaScript, PHP, R, and Golang. Skilled in frameworks like Angular and React and platforms such as Node.js. His expertise spans both front-end and back-end development. His proficiency in the Python language stands as a testament to his versatility and commitment to the craft.