The dplyr::distinct() function in R removes duplicate rows from a data frame or tibble and keeps unique rows. You can provide additional arguments, like columns, to check for duplicates in those specific columns.
Syntax
distinct(.data, ..., .keep_all = FALSE)Parameters
| Argument | Description |
| .data | It is an input data frame or tibble from which to remove duplicate rows. |
| … | You can define specific column names for uniqueness. |
| .keep_all | It is a logical value. If TRUE, it keeps all variables in the output. If FALSE, only the variables used to determine distinct rows are retained. |
Removing duplicates across all columns
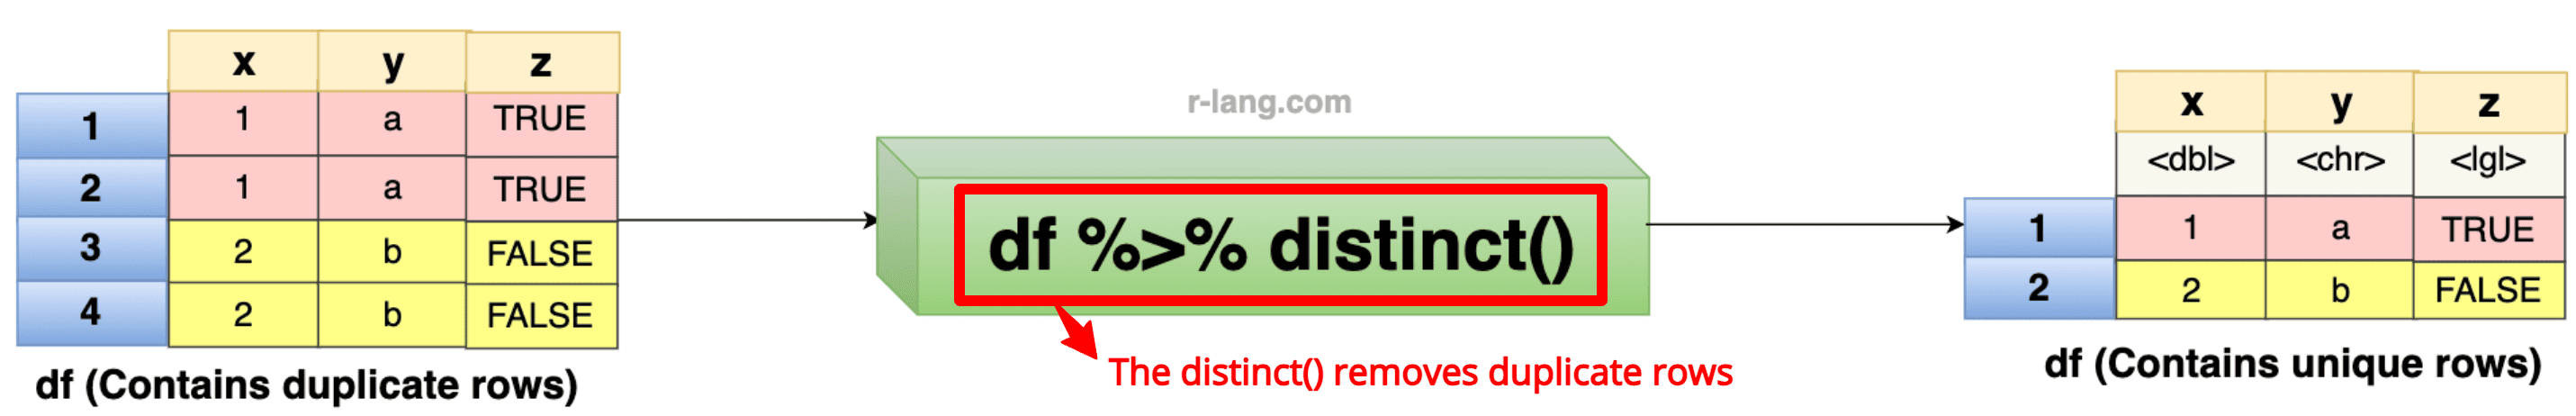
If you don’t pass any argument, it will remove duplicates across all columns from a data frame or tibble.
With data frame
library(dplyr)

df <- data.frame(
  x = c(1, 1, 2, 2),
  y = c("a", "a", "b", "b"),
  z = c(TRUE, TRUE, FALSE, FALSE)
)

df %>% distinct()
Output
   x  y  z
1  1  a  TRUE
2  2  b  FALSE
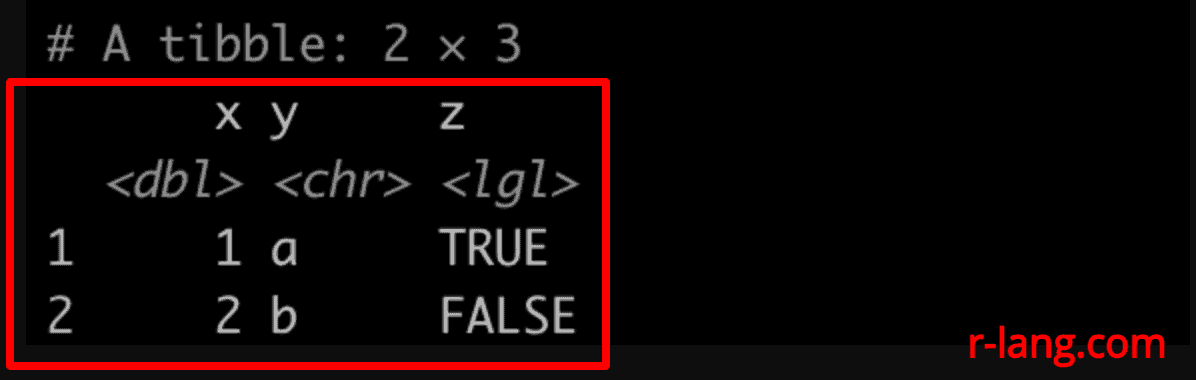
With tibble
library(dplyr)
df <- tibble(
x = c(1, 1, 2, 2),
y = c("a", "a", "b", "b"),
z = c(TRUE, TRUE, FALSE, FALSE)
)
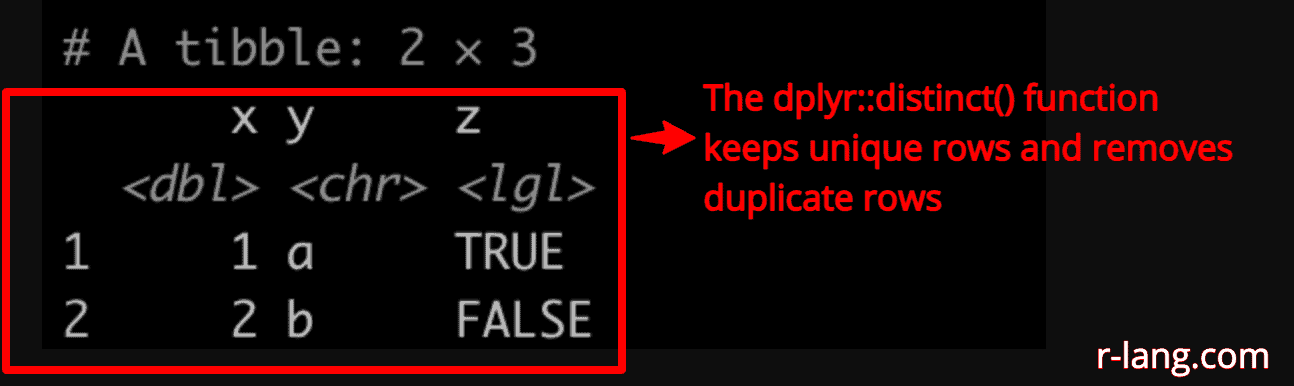
df %>% distinct()
Output
Uniqueness based on specific columns
df <- tibble(
x = c(1, 1, 2, 2),
y = c("a", "a", "b", "b"),
z = c(TRUE, TRUE, FALSE, FALSE)
)
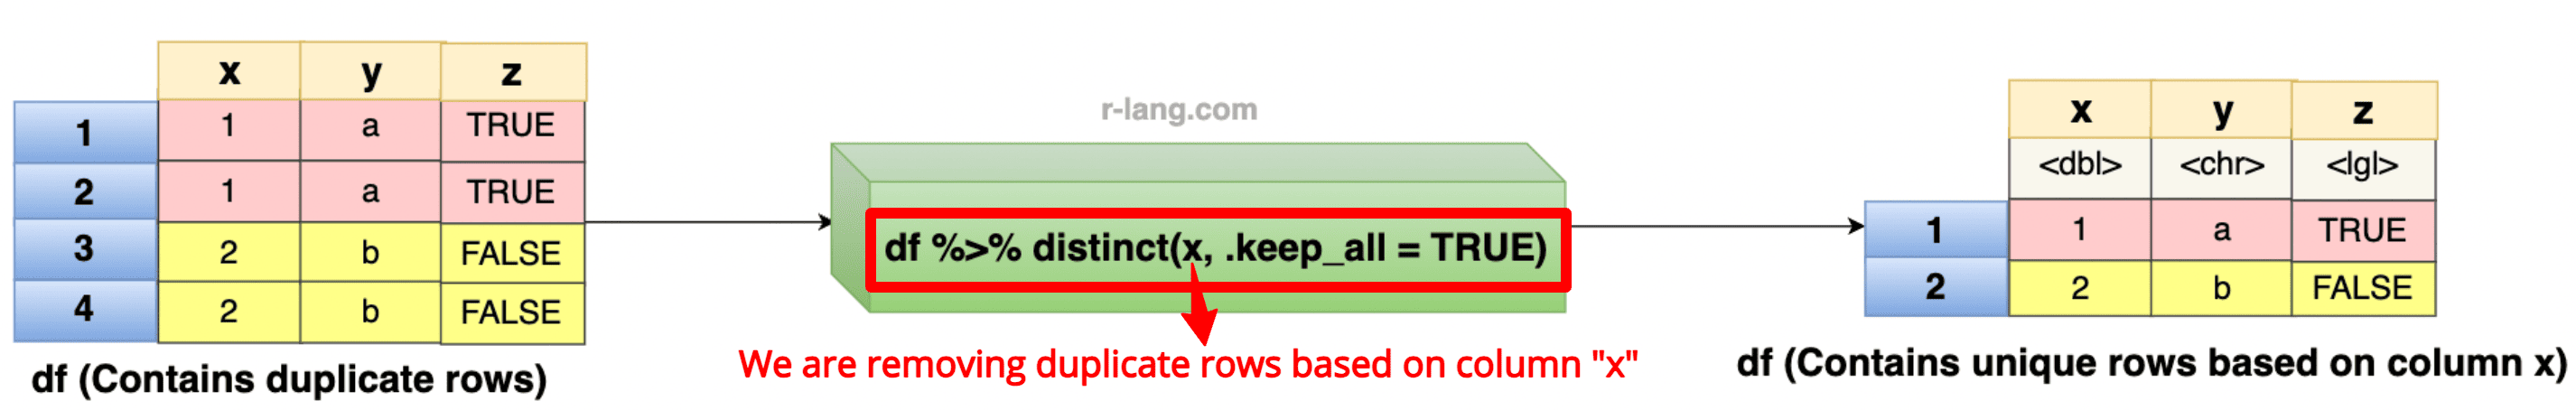
df %>% distinct(x, .keep_all = TRUE)
Output
In this code example, we removed duplicates based on the x column and kept all other columns in the result. Since x has two unique values, the result will have two rows.
Distinct rows based on a specific column
library(dplyr)

df <- data.frame(
  x = c(1, 1, 2, 2, 3, 3),
  y = c("a", "a", "b", "b", "c", "c"),
  z = c(TRUE, TRUE, FALSE, FALSE, TRUE, FALSE)
)

df %>% distinct(z)
Output
     z
1   TRUE
2   FALSE
In this code example, we checked for duplicates based on a combination z column, and only unique values of the z column have been returned.
Keeping All Variables
If you want to retain all columns while removing duplicates based on specific columns, you should pass “.keep_all = TRUE”.
library(dplyr)

df <- data.frame(
  x = c(1, 1, 2, 2, 3, 3),
  y = c("a", "a", "b", "b", "c", "c"),
  z = c(TRUE, TRUE, FALSE, FALSE, TRUE, FALSE)
)

df %>% distinct(z, .keep_all = TRUE)
Output
   x  y   z
1  1  a  TRUE
2  2  b  FALSE
If you want faster results, you should use .keep_all = FALSE (default).
Handling NA Values
If you have duplicate NA values, they will also be removed from the final output.
library(dplyr)

df <- data.frame(
  x = c(1, 1, NA, 2, 3, NA),
  y = c("a", "a", NA, "b", "c", NA),
  z = c(TRUE, TRUE, FALSE, FALSE, TRUE, FALSE)
)

df %>% distinct()
Output
   x  y    z
1  1  a    TRUE
2  NA <NA> FALSE
3  2  b    FALSE
4  3  c    TRUE
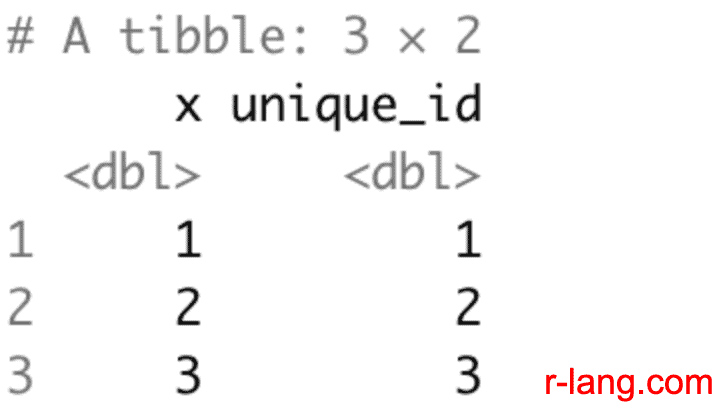
With grouped data
Grouping has no effect on distinct(); it operates on the entire data frame.
To find unique values within groups, you can combine with group_by() and summarize() functions.
library(dplyr)

df <- data.frame(
  x = c(1, 1, 2, 2, 3, 3),
  y = c("a", "a", "b", "b", "c", "c"),
  z = c(TRUE, TRUE, FALSE, FALSE, TRUE, FALSE)
)

df %>%
  group_by(x) %>%
  summarize(unique_id = first(x))
Output
That’s all!

Krunal Lathiya is a seasoned Computer Science expert with over eight years in the tech industry. He boasts deep knowledge in Data Science and Machine Learning. Versed in Python, JavaScript, PHP, R, and Golang. Skilled in frameworks like Angular and React and platforms such as Node.js. His expertise spans both front-end and back-end development. His proficiency in the Python language stands as a testament to his versatility and commitment to the craft.