The prop.table() function in R calculates the proportion or relative frequency of values in a contingency table. It calculates the value of each cell in a table as a proportion of all values.
For example, let’s say you have a table with a total of 5 elements like this: table(c(“A”, “B”, “C”, “D”, “E”)).
Each value occurs only once, so for each value, the count is 1, and the total count is 5.
Now, the prop.table() function divides each cell by the total. So, each element’s count is proportional to the total count: 1/5 = 0.2.
When you use this function, the sum of all proportions = 1 because it rescales counts into weights (probabilities).
This function transforms the absolute frequencies (counts) into relative proportions.
Here is another code example with a figure:
data <- c("mercedez", "bmw", "jaguar", "land rover", "audi")

# Creating a table from the data
table <- table(data)

# Calculating the proportions of the table
proportions <- prop.table(table)

print(proportions)

# Output:
# data
#  audi  bmw   jaguar  land rover  mercedez
#  0.2   0.2    0.2       0.2        0.2
In this code, each cell is divided by the total number of elements, which is 5. Divide each element 1 by 5 = 0.2, and hence each got the frequency of 0.2.
prop.table(input, margin = NULL)| Argument | Description |
| input | It represents an object of class “table”, an array, or a matrix containing numeric values. |
| margin | It represents an integer vector specifying the dimensions (margins) over which to compute the proportions. |
You can use the “margin” argument to specify the dimensions.
There are two types of margins.
margin = 2(column-wise): It sums down columns. Each column sums to 1.
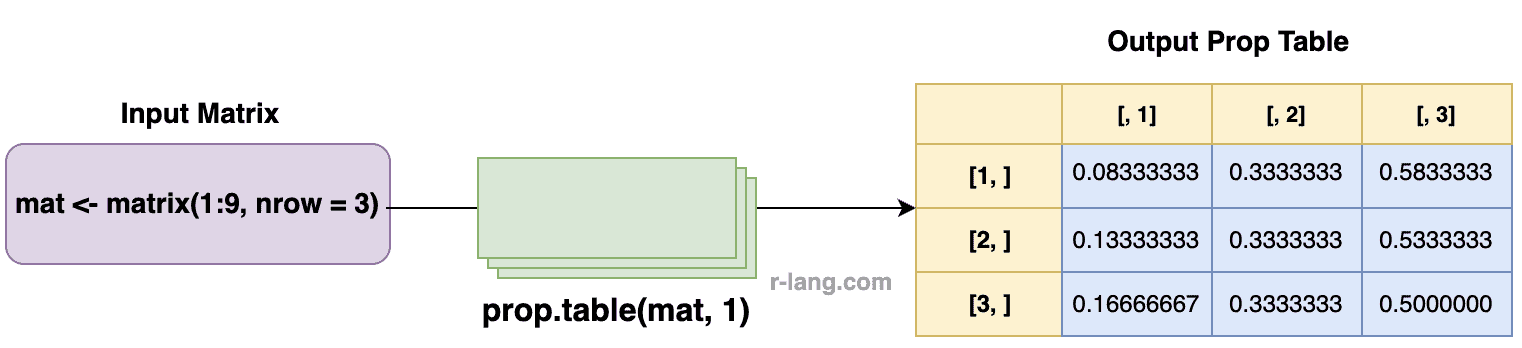
If we want row-wise proportions, we can pass 1 as a second argument to the prop.table() method.
mat <- matrix(1:9, 3)

print(mat)

# Output:
#      [,1]  [,2]   [,3]
# [1,]   1     4      7
# [2,]   2     5      8
# [3,]   3     6      9

pt <- prop.table(mat, 1)

print(pt)

# Output:
#           [,1]        [,2]       [,3]
# [1,]   0.08333333  0.3333333   0.5833333
# [2,]   0.13333333  0.3333333   0.5333333
# [3,]   0.16666667  0.3333333   0.5000000
For getting column-wise proportions, you can pass 2 as a second argument to this method.
mat <- matrix(1:9, 3)

pt <- prop.table(mat, 2)

print(pt)

# Output:
#        [,1]        [,2]       [,3]
# [1,]  0.1666667  0.2666667   0.2916667
# [2,]  0.3333333  0.3333333   0.3333333
# [3,]  0.5000000  0.4000000   0.3750000
Ensure that you interpret the proportions in the context of how they were calculated (overall, row-wise, or column-wise) to draw meaningful conclusions from your data.
If you have an empty table, it handles a zero-length table gracefully without any error, but returns useless empty output.
empty_table <- table(numeric(0))

prop.table(empty_table)

# Output: numeric(0)If you pass an empty matrix, it returns an empty matrix because there is nothing to proportionate.
empty_table <- table(numeric(0), numeric(0))

prop.table(empty_table)

# Output: <0 x 0 matrix>
As you can see, the prop.table() preserves the structure and returns another empty matrix.
There is a difference between a zero-only table and an empty table. Empty means nothing in the table and zero-only table contains value 0. Every count is 0.
When prop.table() attempts to normalize such a table, it ends up dividing by 0 (since the total is 0). For truly zero-sum structures (e.g., all-zero matrices or empty tables): NaN or empty output.
zero_mat <- matrix(0, nrow = 1, ncol = 1)

prop.table(zero_mat)

# Output:
#        [,1]
# [1,]   NaN
Always check sum(x) > 0 before applying prop.table() to avoid undefined results.
That’s it!
Krunal Lathiya is a seasoned Computer Science expert with over eight years in the tech industry. He boasts deep knowledge in Data Science and Machine Learning. Versed in Python, JavaScript, PHP, R, and Golang. Skilled in frameworks like Angular and React and platforms such as Node.js. His expertise spans both front-end and back-end development. His proficiency in the Python language stands as a testament to his versatility and commitment to the craft.
The scale() function in R centers (subtracting the mean) and/or scales (dividing by the standard…
To rename a file in R, you can use the file.rename() function. It renames a…
The exp() is a built-in function that calculates the exponential of its input, raising Euler's…
The split() function divides the input data into groups based on some criteria, typically specified…
The colMeans() function in R calculates the arithmetic mean of columns in a numeric matrix,…
The rowMeans() is a built-in, highly vectorized function in R that computes the arithmetic mean…