The easiest way to calculate the natural log of a number or vector in R is to use the built-in log() function.
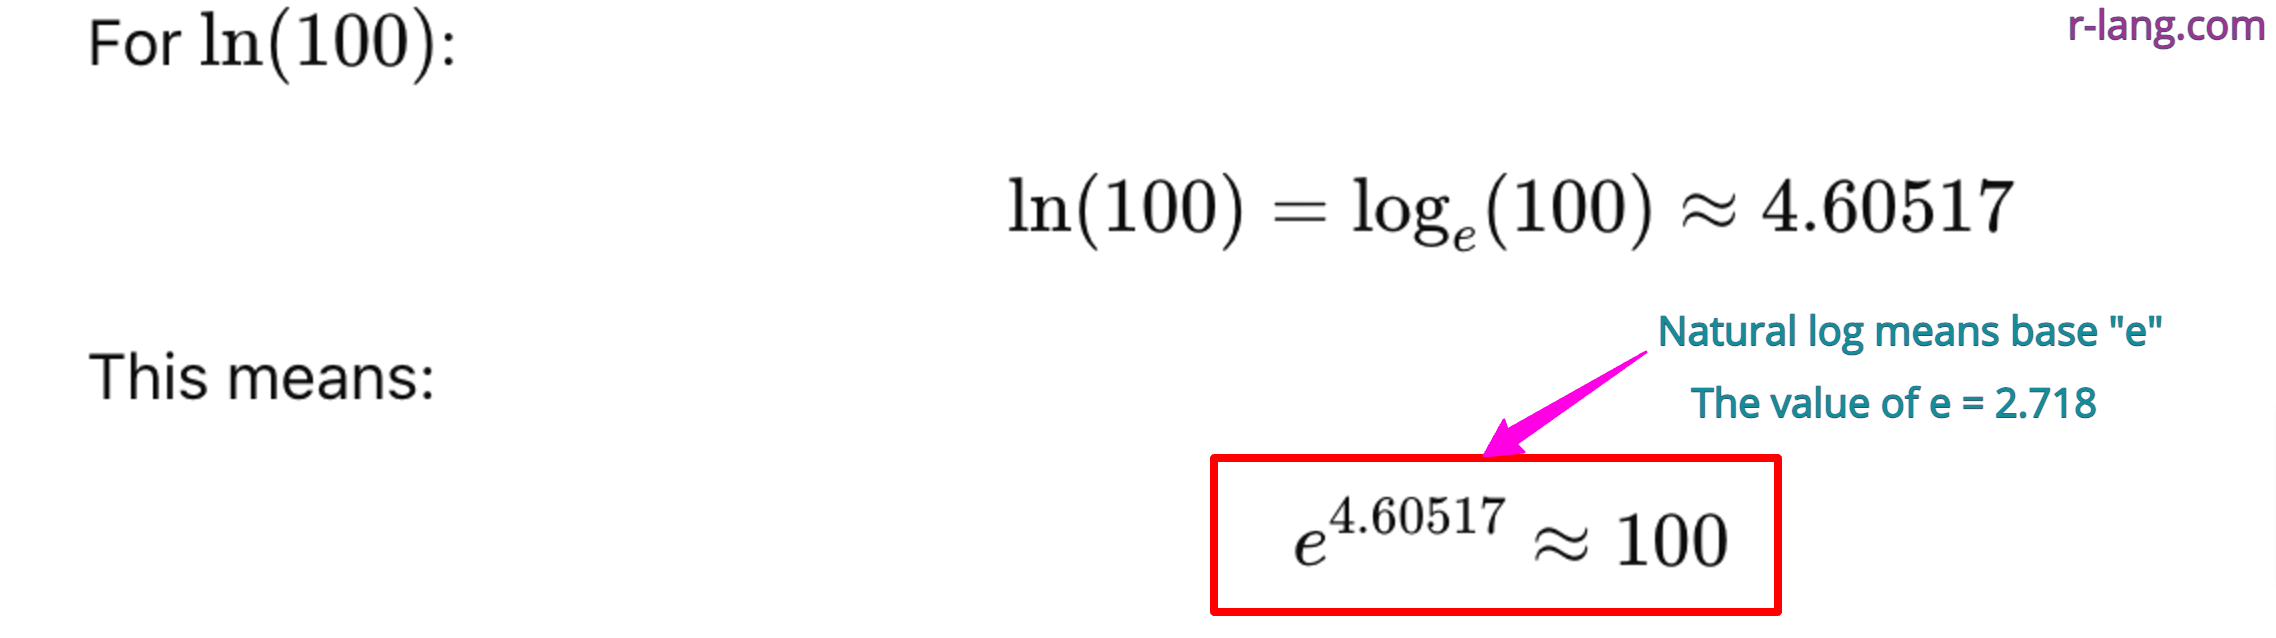
The natural log uses “e” as its base, whereas log10 uses 10. The “e” is Euler’s number, whose value is approximately 2.718.
In R, the formula for the natural log is ln(x) = loge(x), where e is the base.
One common confusion is that if you follow the “Calculators (mechanical device),” natural log means log10. However, if you are working with the language R, log is the natural log, and log10 is a different logarithm.
In this article, we will calculate the log of a value to the base e. Our core focus is on the natural log and not different bases.
Let’s take e as base and num as 100 and find the logarithm.
log(100) # 4.60517You can see that the natural log of 100 is 4.60517.
Define a numerical vector, pass the vector to the log() function, and see the output.
numbers_vec <- c(0, 1, 2, 10, 100)

natural_log_numbers <- log(numbers_vec)

natural_log_numbers

# [1] -Inf 0.0000000 0.6931472 2.3025851 4.6051702
You can see that the output is also a vector but each element is the natural log of input vector’s each element.
The natural log of 0 is -Inf.
The natural log of 100 is 4.60517, as we already saw earlier.
Complex numbers are built upon real and imaginary numbers, but R handles them with ease because it has built-in capabilities to handle complex values well.
Define a vector of complex numbers and then calculate its ln values.
complex_vec <- c(0 + 1i, 1 + 3i, 19 + 21i)

natural_log_complex <- log(complex_vec)

natural_log_complex
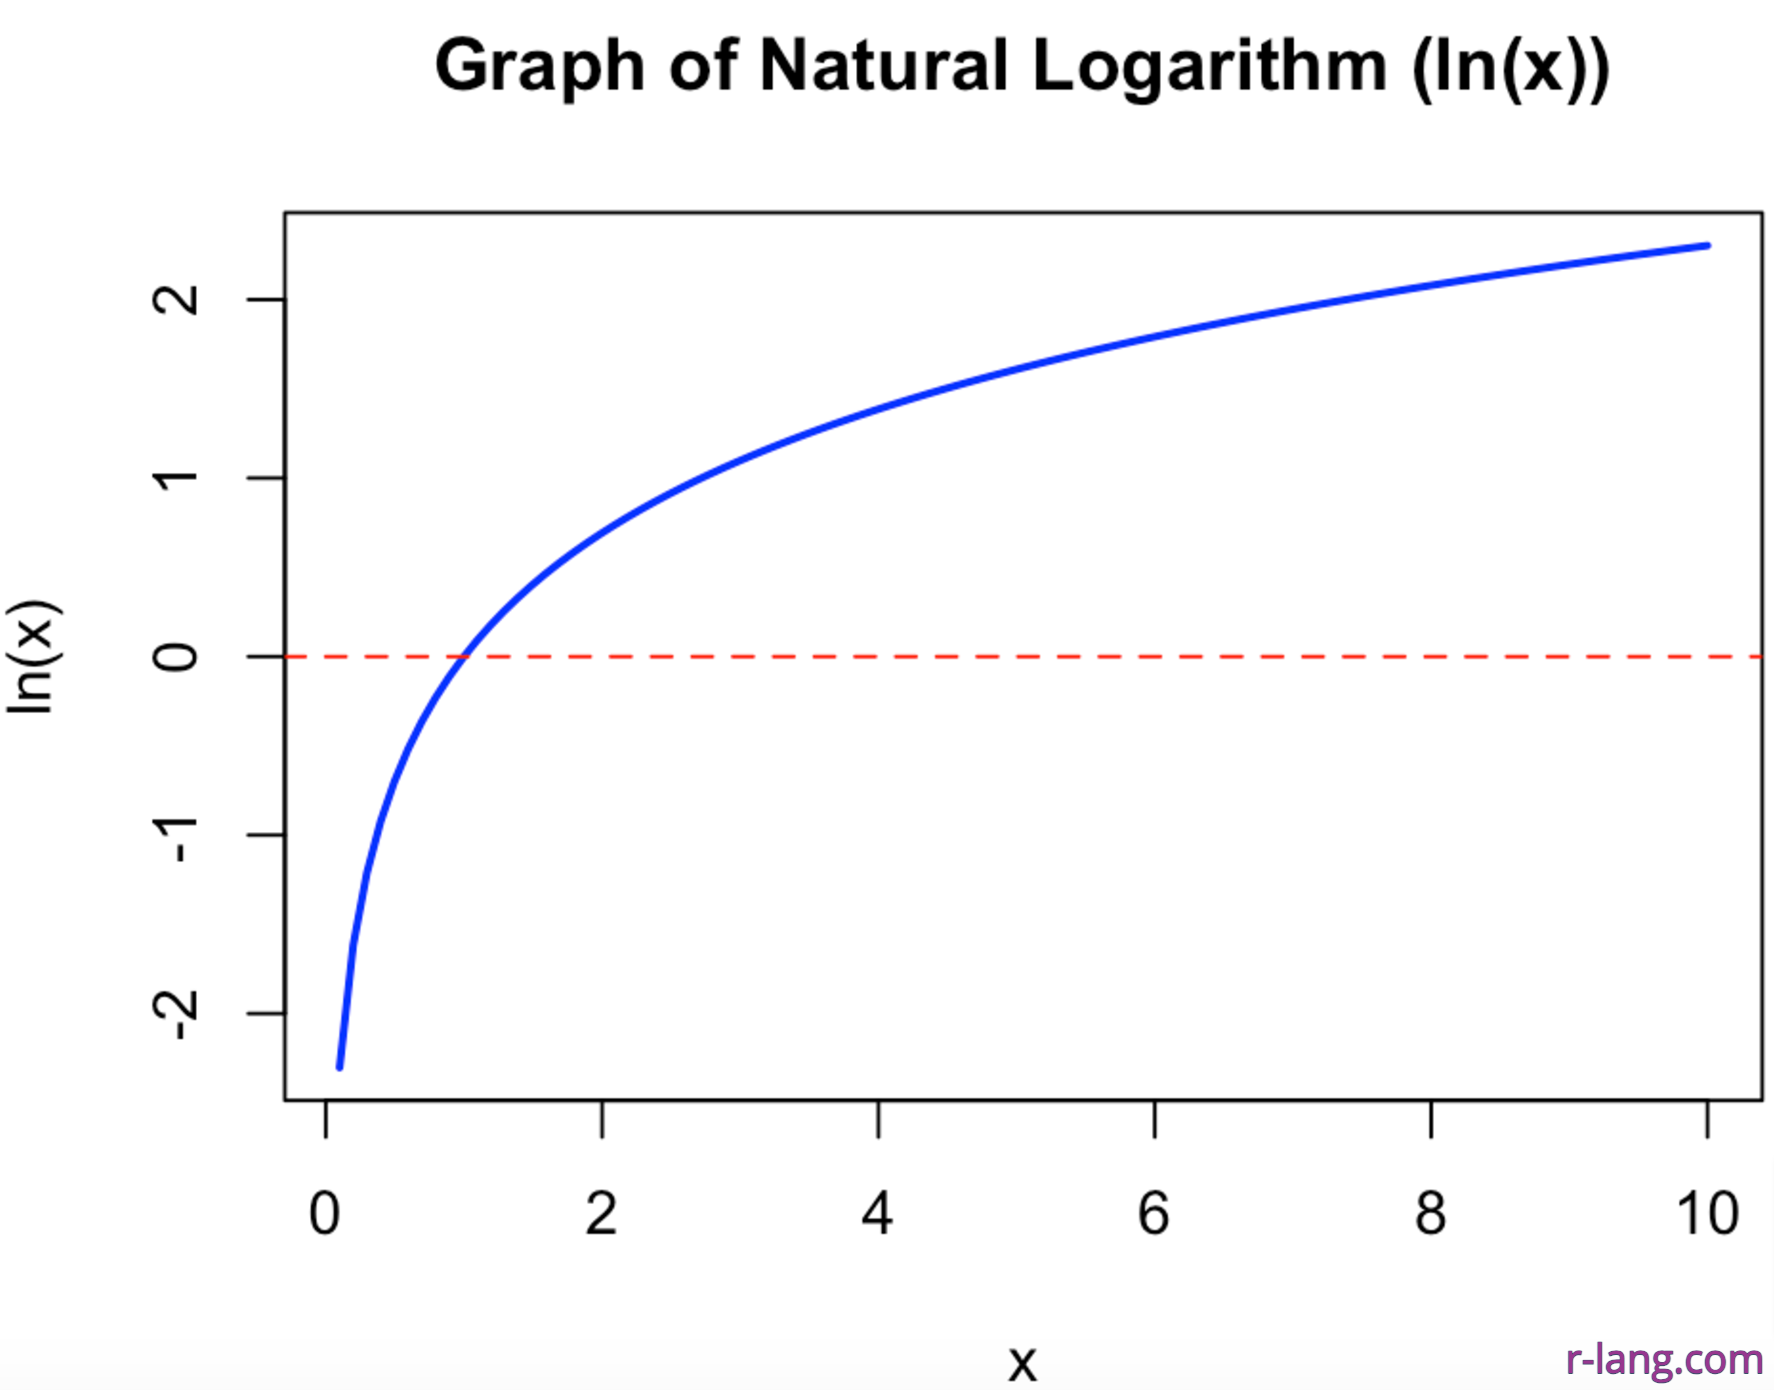
# 0.000000+1.570796i 1.151293+1.249046i 3.343554+0.835357iTo plot the log() function on the graph, we can use the “curve()” function, which accepts the log() function and various other arguments and is used in conjunction with the abline() function to draw the horizontal axis.
# Plotting the natural logarithm function

curve(log(x),
  from = 0.1, to = 10, col = "blue", lwd = 2,
  xlab = "x", ylab = "ln(x)",
  main = "Graph of Natural Logarithm (ln(x))"
)

abline(h = 0, col = "red", lty = 2) # Horizontal axis
abline(v = 1, col = "green", lty = 2) # ln(1) = 0
That’s all!
Krunal Lathiya is a seasoned Computer Science expert with over eight years in the tech industry. He boasts deep knowledge in Data Science and Machine Learning. Versed in Python, JavaScript, PHP, R, and Golang. Skilled in frameworks like Angular and React and platforms such as Node.js. His expertise spans both front-end and back-end development. His proficiency in the Python language stands as a testament to his versatility and commitment to the craft.
The scale() function in R centers (subtracting the mean) and/or scales (dividing by the standard…
To rename a file in R, you can use the file.rename() function. It renames a…
The prop.table() function in R calculates the proportion or relative frequency of values in a…
The exp() is a built-in function that calculates the exponential of its input, raising Euler's…
The split() function divides the input data into groups based on some criteria, typically specified…
The colMeans() function in R calculates the arithmetic mean of columns in a numeric matrix,…