Here are three ways to calculate the mean by group for single or multiple columns in the R data frame:
What does it mean when we say “mean by group”? It means grouping the data based on the values of single or multiple columns and then calculating the mean (average) of those values, but doing so separately for each group.
Here is the sample data frame:
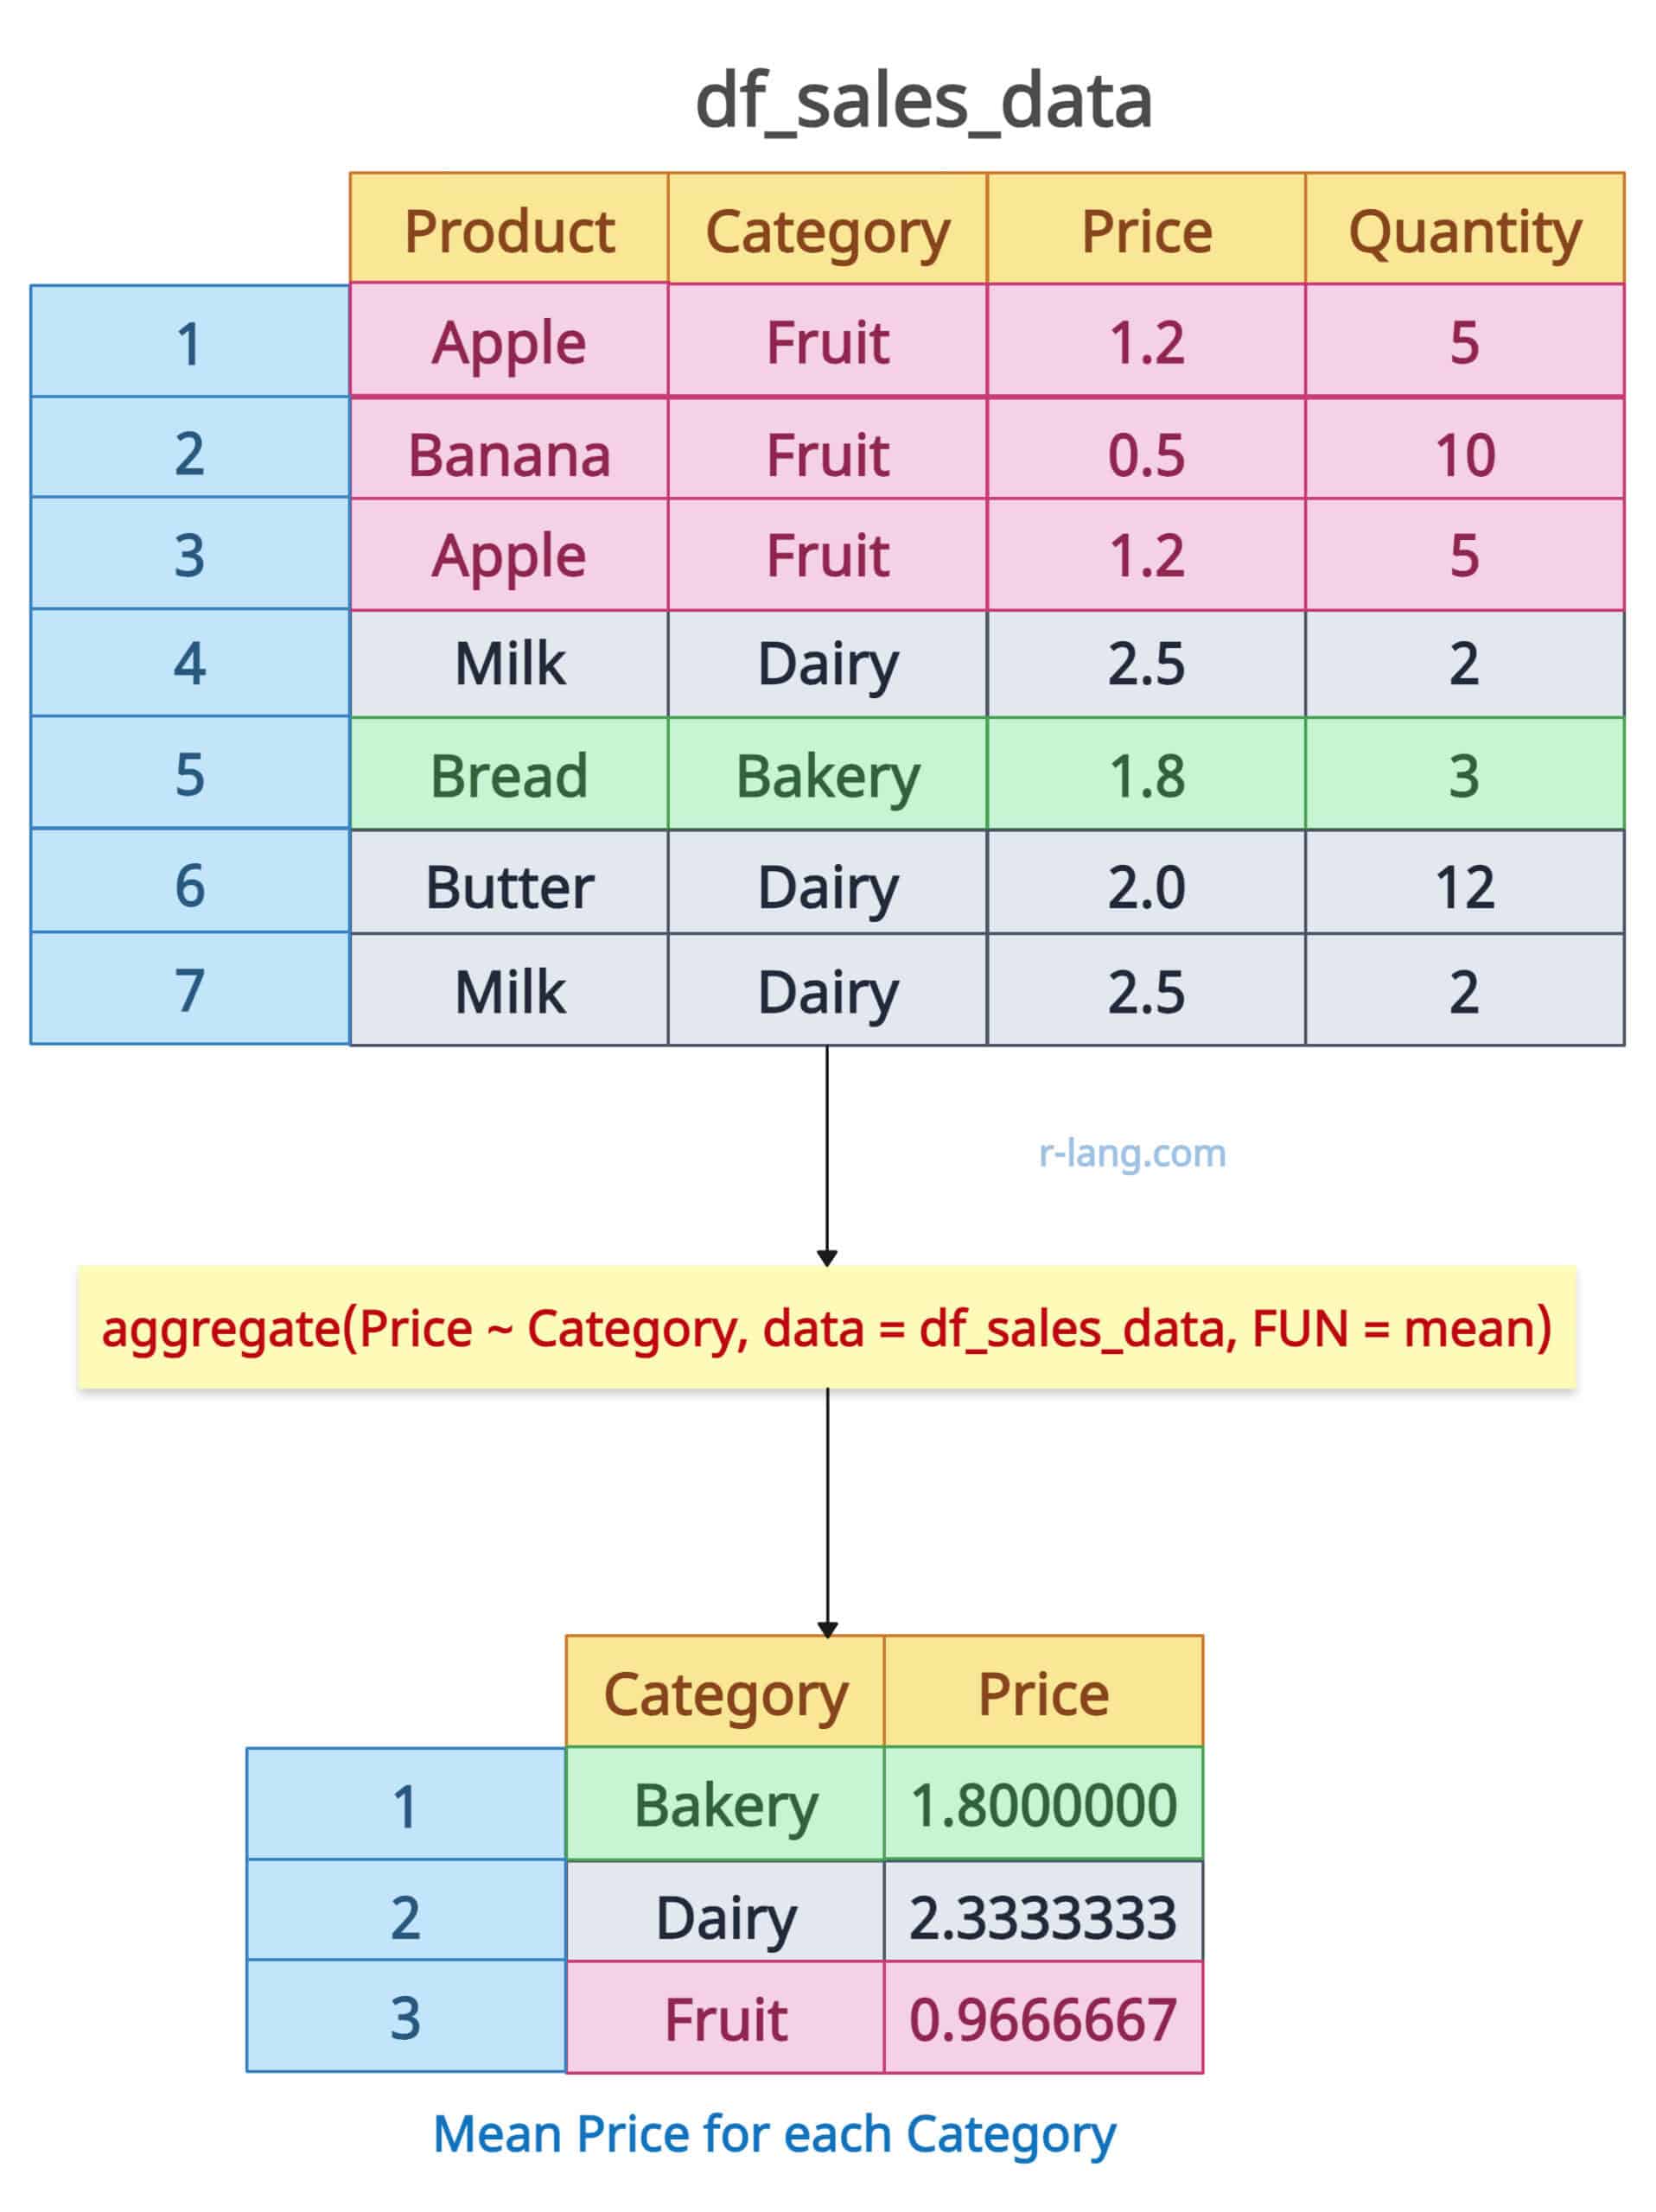
The aggregate() function splits the data into subgroups and calculates the summary for each group. In the context of our article, we can split the data based on the specific column(s) groups and calculate the mean for each group.
In our df_sales_data dataset, we can group the data frame by the Category column and calculate the mean of only one column (Price) for each Category.
The aggregate() function accepts three arguments:
df_sales_data <- data.frame(
  Product = c("Apple", "Banana", "Apple", "Milk", "Bread", "Butter", "Milk"),
  Category = c("Fruit", "Fruit", "Fruit", "Dairy", "Bakery", "Dairy", "Dairy"),
  Price = c(1.2, 0.5, 1.2, 2.5, 1.8, 2.0, 2.5),
  Quantity = c(5, 10, 5, 2, 3, 12, 2),
  stringsAsFactors = FALSE
)

print(df_sales_data)

# Mean Price by Category
aggregate(Price ~ Category, data = df_sales_data, FUN = mean)
Output
In our data frame,
You can calculate the mean of multiple columns (e.g., Price and Quantity) grouped by a single column (Category) using the aggregate() function.
df_sales_data <- data.frame(
  Product = c("Apple", "Banana", "Apple", "Milk", "Bread", "Butter", "Milk"),
  Category = c("Fruit", "Fruit", "Fruit", "Dairy", "Bakery", "Dairy", "Dairy"),
  Price = c(1.2, 0.5, 1.2, 2.5, 1.8, 2.0, 2.5),
  Quantity = c(5, 10, 5, 2, 3, 12, 2),
  stringsAsFactors = FALSE
)

print(df_sales_data)


# Mean Price and Quantity by Category
aggregate(cbind(Price, Quantity) ~ Category, data = df_sales_data, FUN = mean)
Output
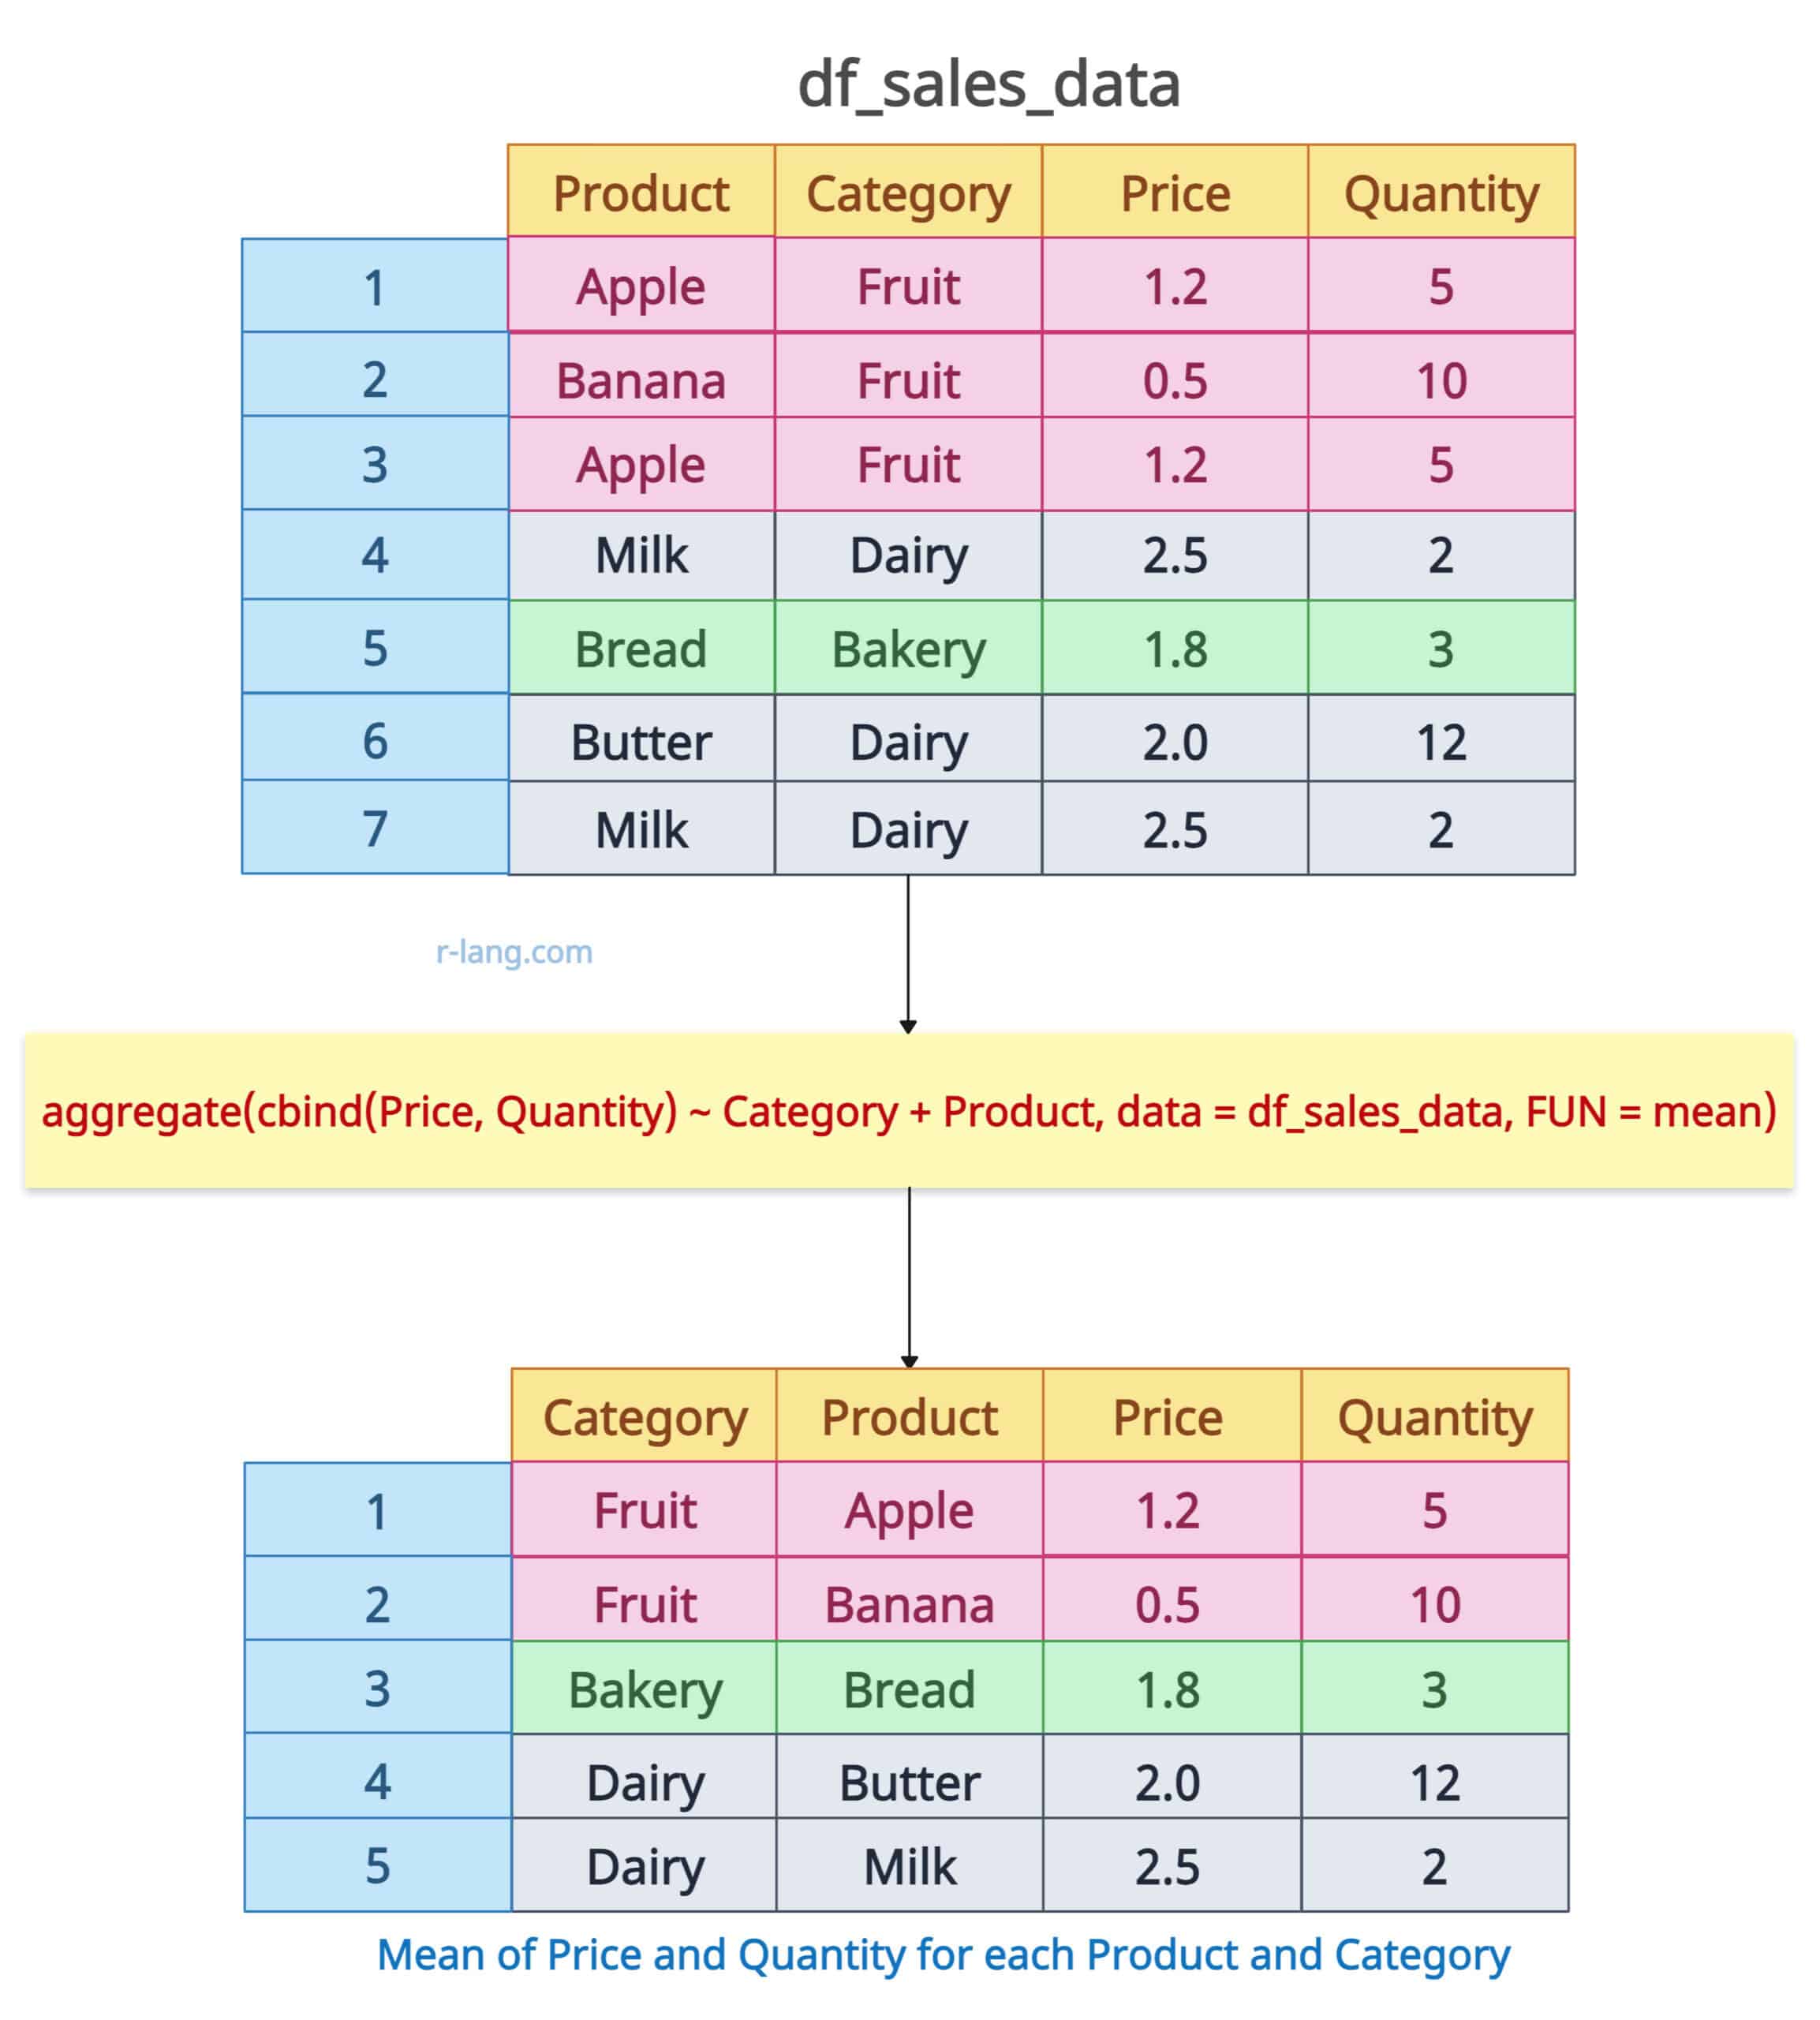
As the name suggests, we can calculate the mean of multiple columns (Price and Quantity) grouped by multiple categorical variables (Category and Product).
df_sales_data <- data.frame(
  Product = c("Apple", "Banana", "Apple", "Milk", "Bread", "Butter", "Milk"),
  Category = c("Fruit", "Fruit", "Fruit", "Dairy", "Bakery", "Dairy", "Dairy"),
  Price = c(1.2, 0.5, 1.2, 2.5, 1.8, 2.0, 2.5),
  Quantity = c(5, 10, 5, 2, 3, 12, 2),
  stringsAsFactors = FALSE
)

print(df_sales_data)

# Mean Price and Quantity group by Category and Product
aggregate(cbind(Price, Quantity) ~ Category + Product, data = df_sales_data, FUN = mean)
Output
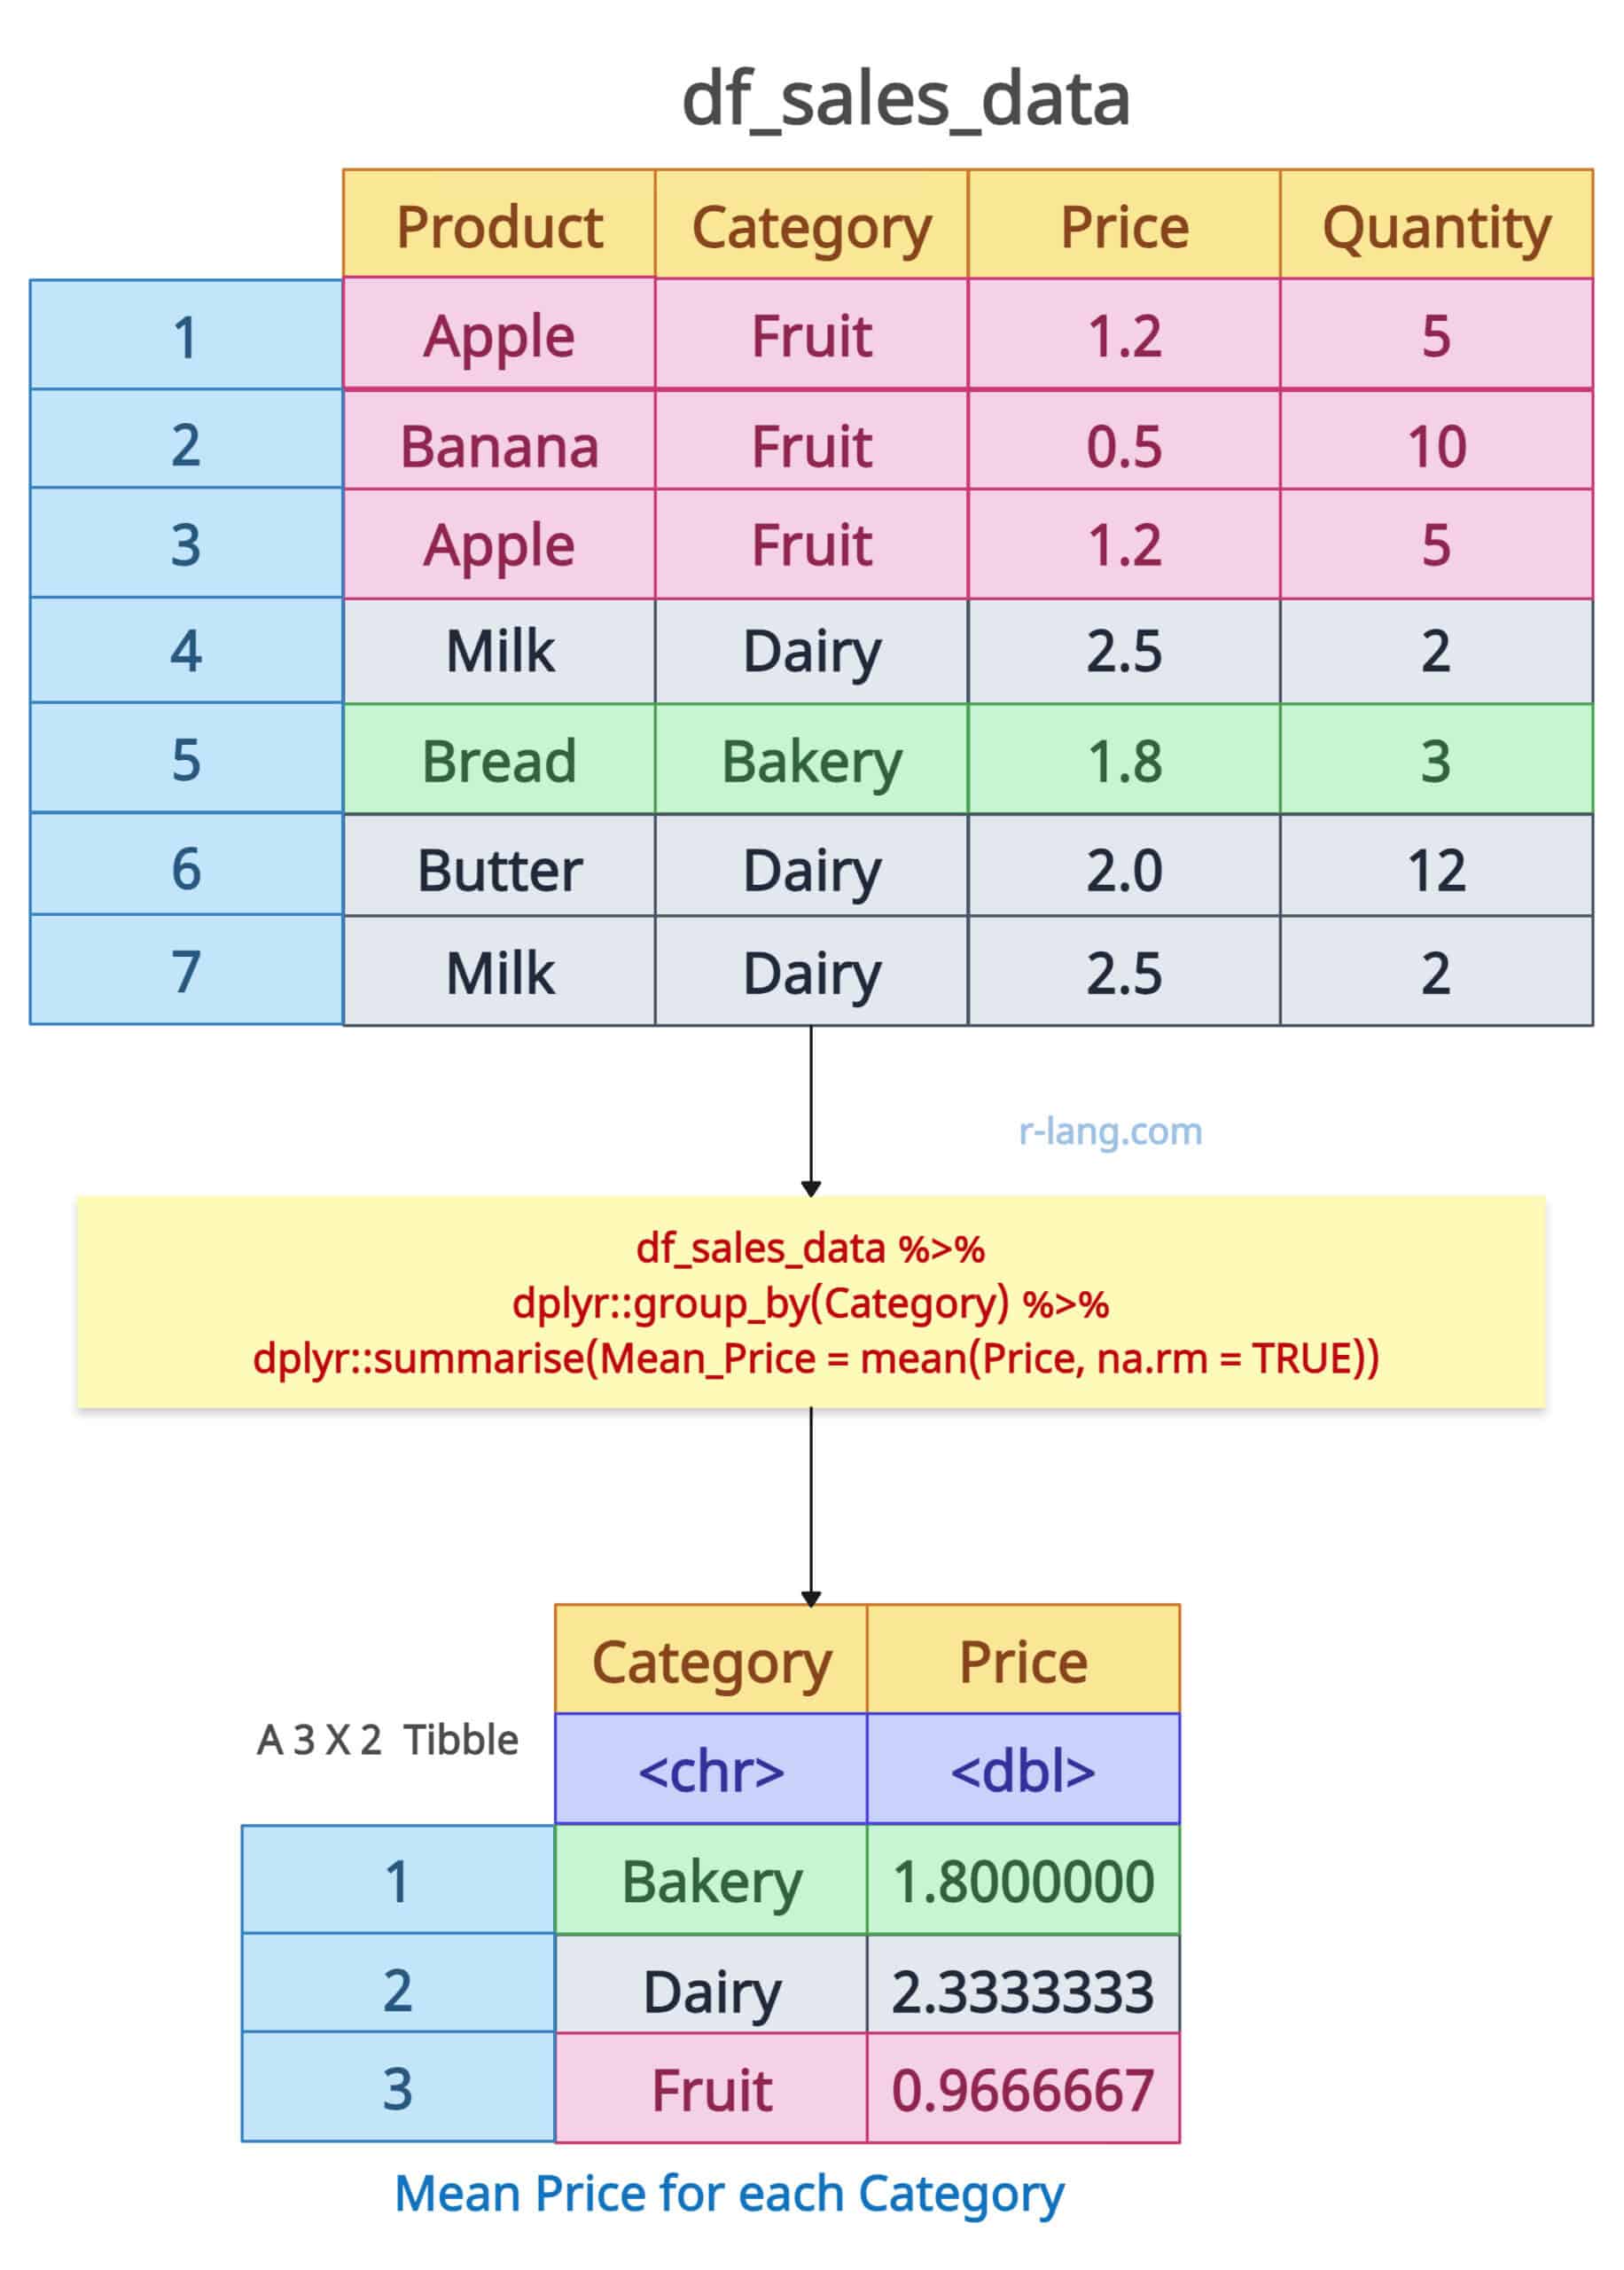
If you combine the group_by() and summarise() functions, the output will be in a tibble.
The group_by() method accepts a data frame and one or more columns as arguments, grouping the data frame based on the unique values of the provided columns.
Then, we use the summarise() function, which accepts a function—mean in our case—to calculate the mean for each group.
Before using dplyr, you must install it in your environment and then load it using the code below:
library(dplyr)Let’s calculate the mean of Price grouped by Category:
library(dplyr)


df_sales_data <- data.frame(
  Product = c("Apple", "Banana", "Apple", "Milk", "Bread", "Butter", "Milk"),
  Category = c("Fruit", "Fruit", "Fruit", "Dairy", "Bakery", "Dairy", "Dairy"),
  Price = c(1.2, 0.5, 1.2, 2.5, 1.8, 2.0, 2.5),
  Quantity = c(5, 10, 5, 2, 3, 12, 2),
  stringsAsFactors = FALSE
)

print(df_sales_data)

# Calculate the mean of Price grouped by Category:
df_sales_data %>%
  group_by(Category) %>%
  summarise(Mean_Price = mean(Price, na.rm = TRUE))
Output
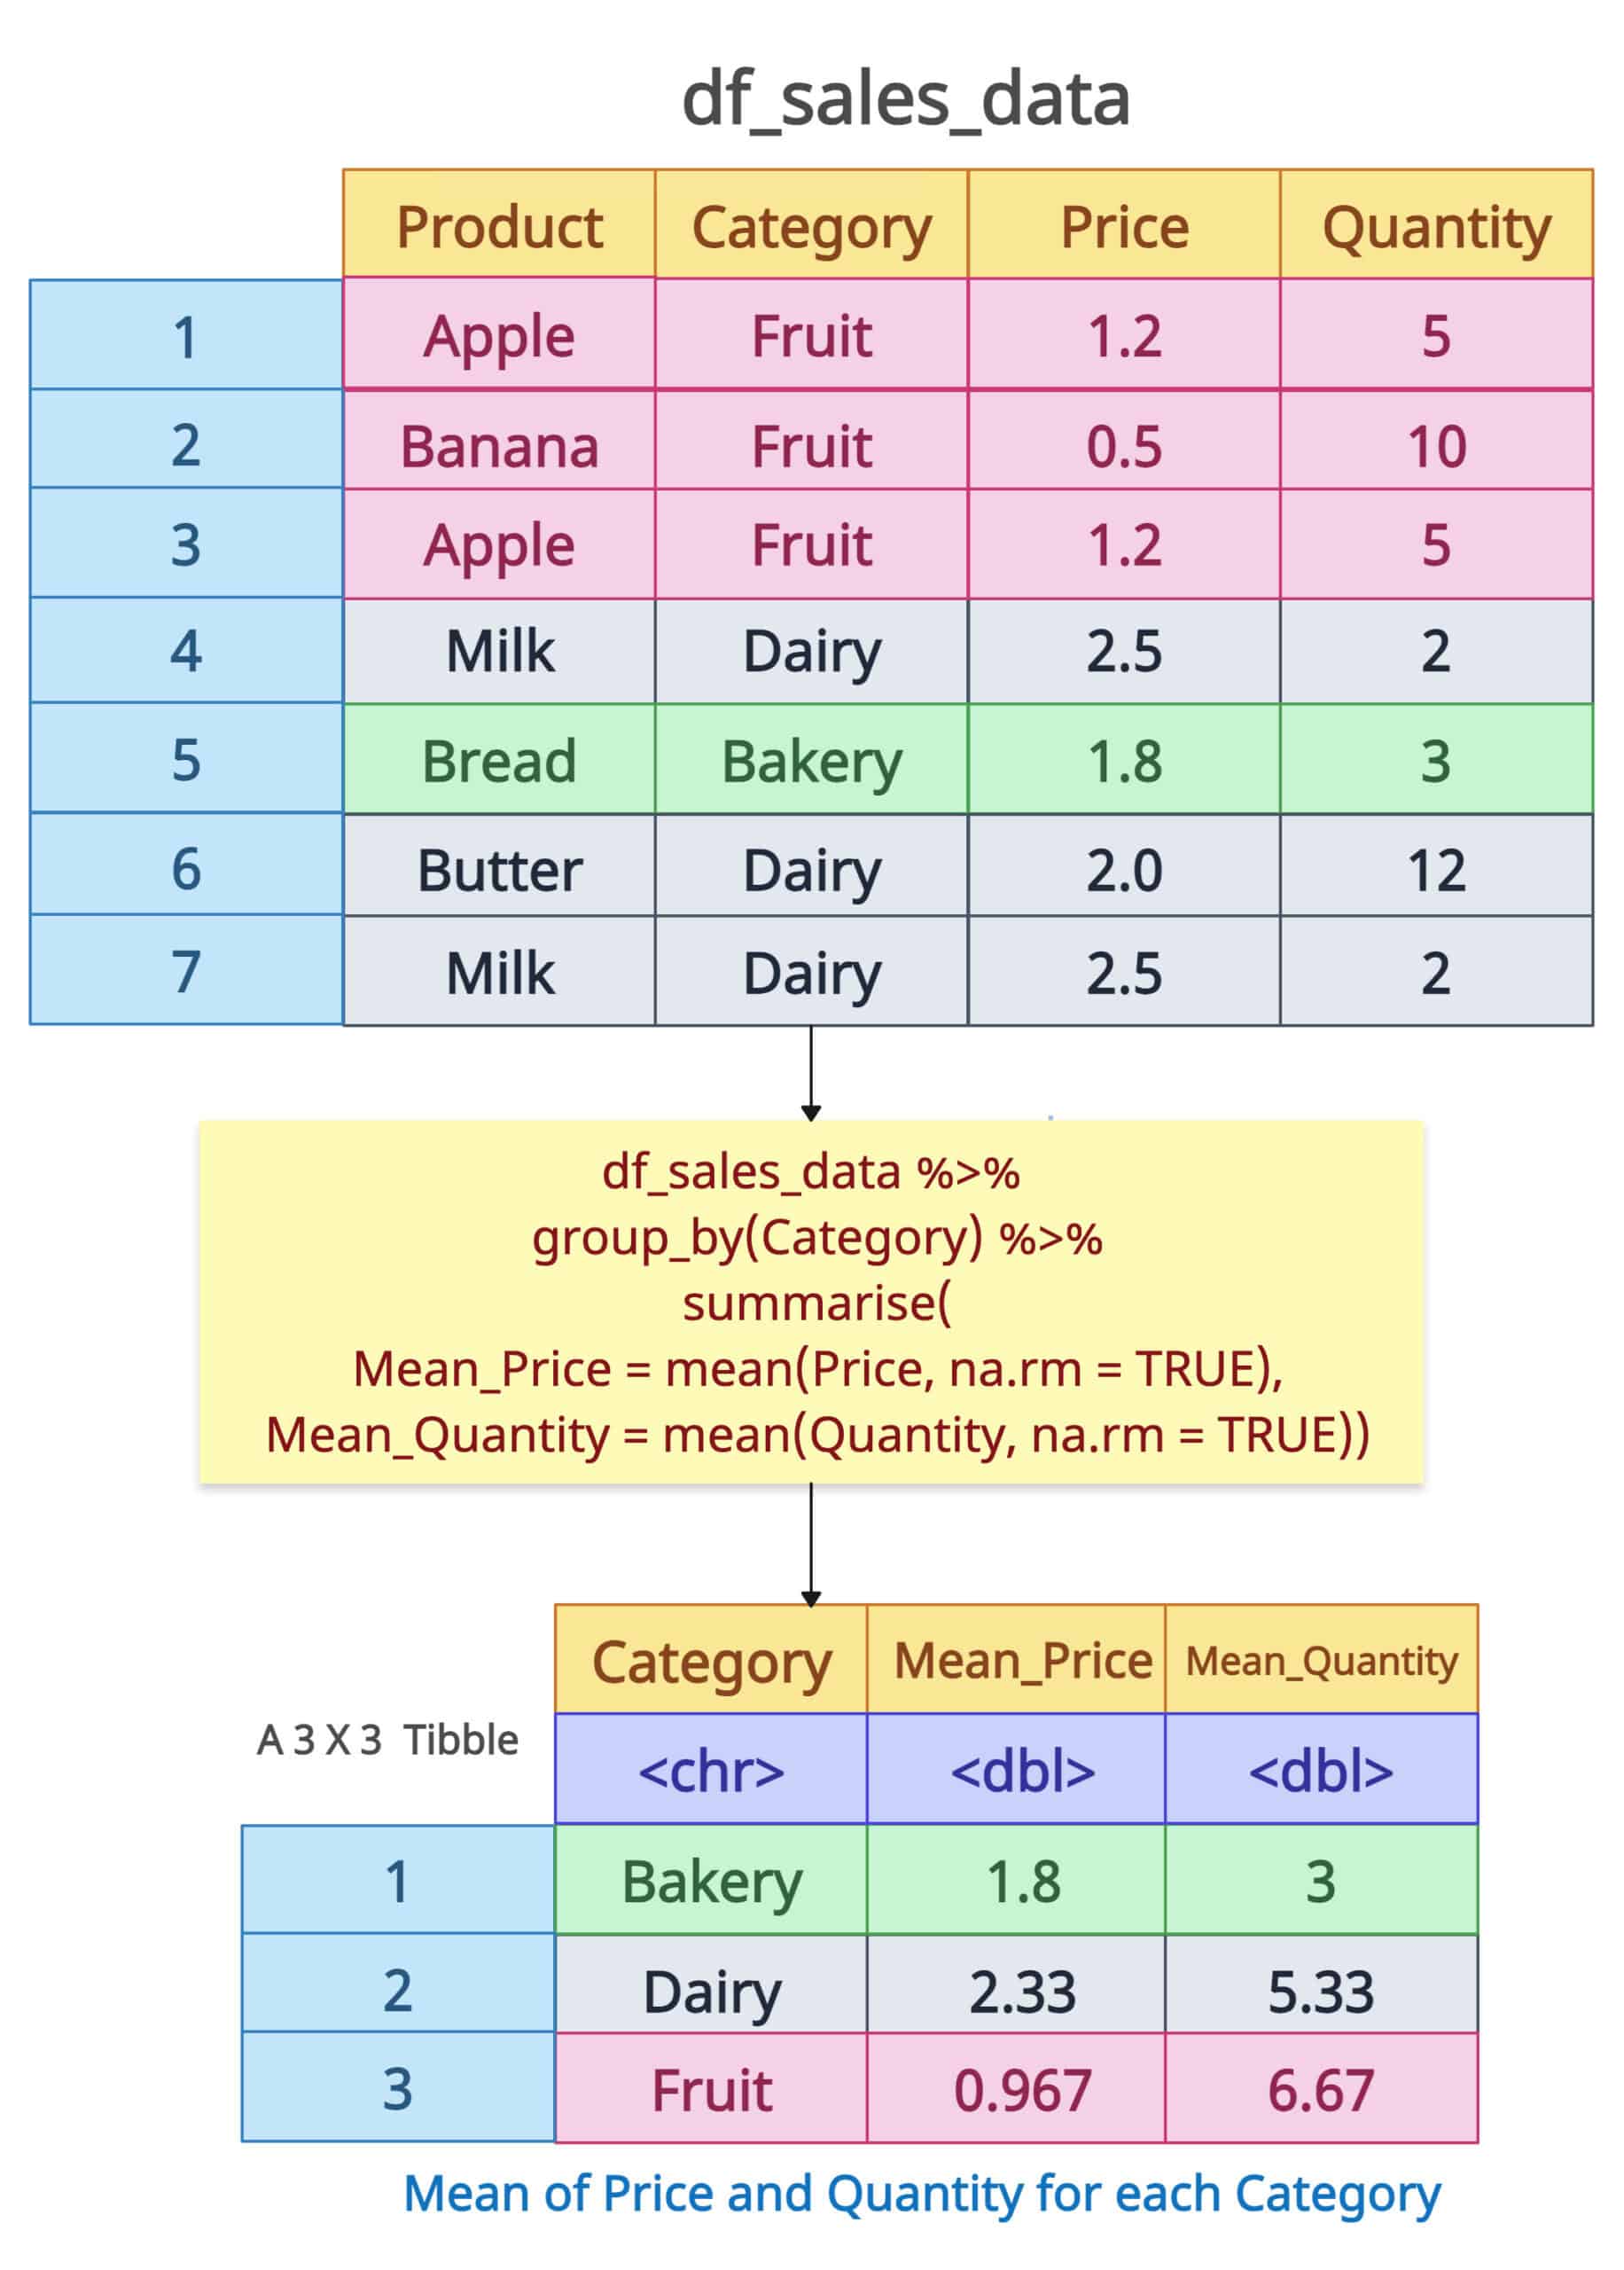
Let’s find the mean of Price and Quantity, grouped by Category.
library(dplyr)


df_sales_data <- data.frame(
  Product = c("Apple", "Banana", "Apple", "Milk", "Bread", "Butter", "Milk"),
  Category = c("Fruit", "Fruit", "Fruit", "Dairy", "Bakery", "Dairy", "Dairy"),
  Price = c(1.2, 0.5, 1.2, 2.5, 1.8, 2.0, 2.5),
  Quantity = c(5, 10, 5, 2, 3, 12, 2),
  stringsAsFactors = FALSE
)

print(df_sales_data)

# Calculate the mean of Price and Quantity grouped by Category

df_sales_data %>%
  group_by(Category) %>%
  summarise(
    Mean_Price = mean(Price, na.rm = TRUE),
    Mean_Quantity = mean(Quantity, na.rm = TRUE)
  )
Output
Let’s calculate the mean of Price and Quantity grouped by Category and Product:
library(dplyr)


df_sales_data <- data.frame(
  Product = c("Apple", "Banana", "Apple", "Milk", "Bread", "Butter", "Milk"),
  Category = c("Fruit", "Fruit", "Fruit", "Dairy", "Bakery", "Dairy", "Dairy"),
  Price = c(1.2, 0.5, 1.2, 2.5, 1.8, 2.0, 2.5),
  Quantity = c(5, 10, 5, 2, 3, 12, 2),
  stringsAsFactors = FALSE
)

print(df_sales_data)

# Calculate the mean of Price and Quantity grouped by Category and Product
df_sales_data %>%
   group_by(Category, Product) %>%
   summarise(
   Mean_Price = mean(Price, na.rm = TRUE),
   Mean_Quantity = mean(Quantity, na.rm = TRUE)
 )
Output
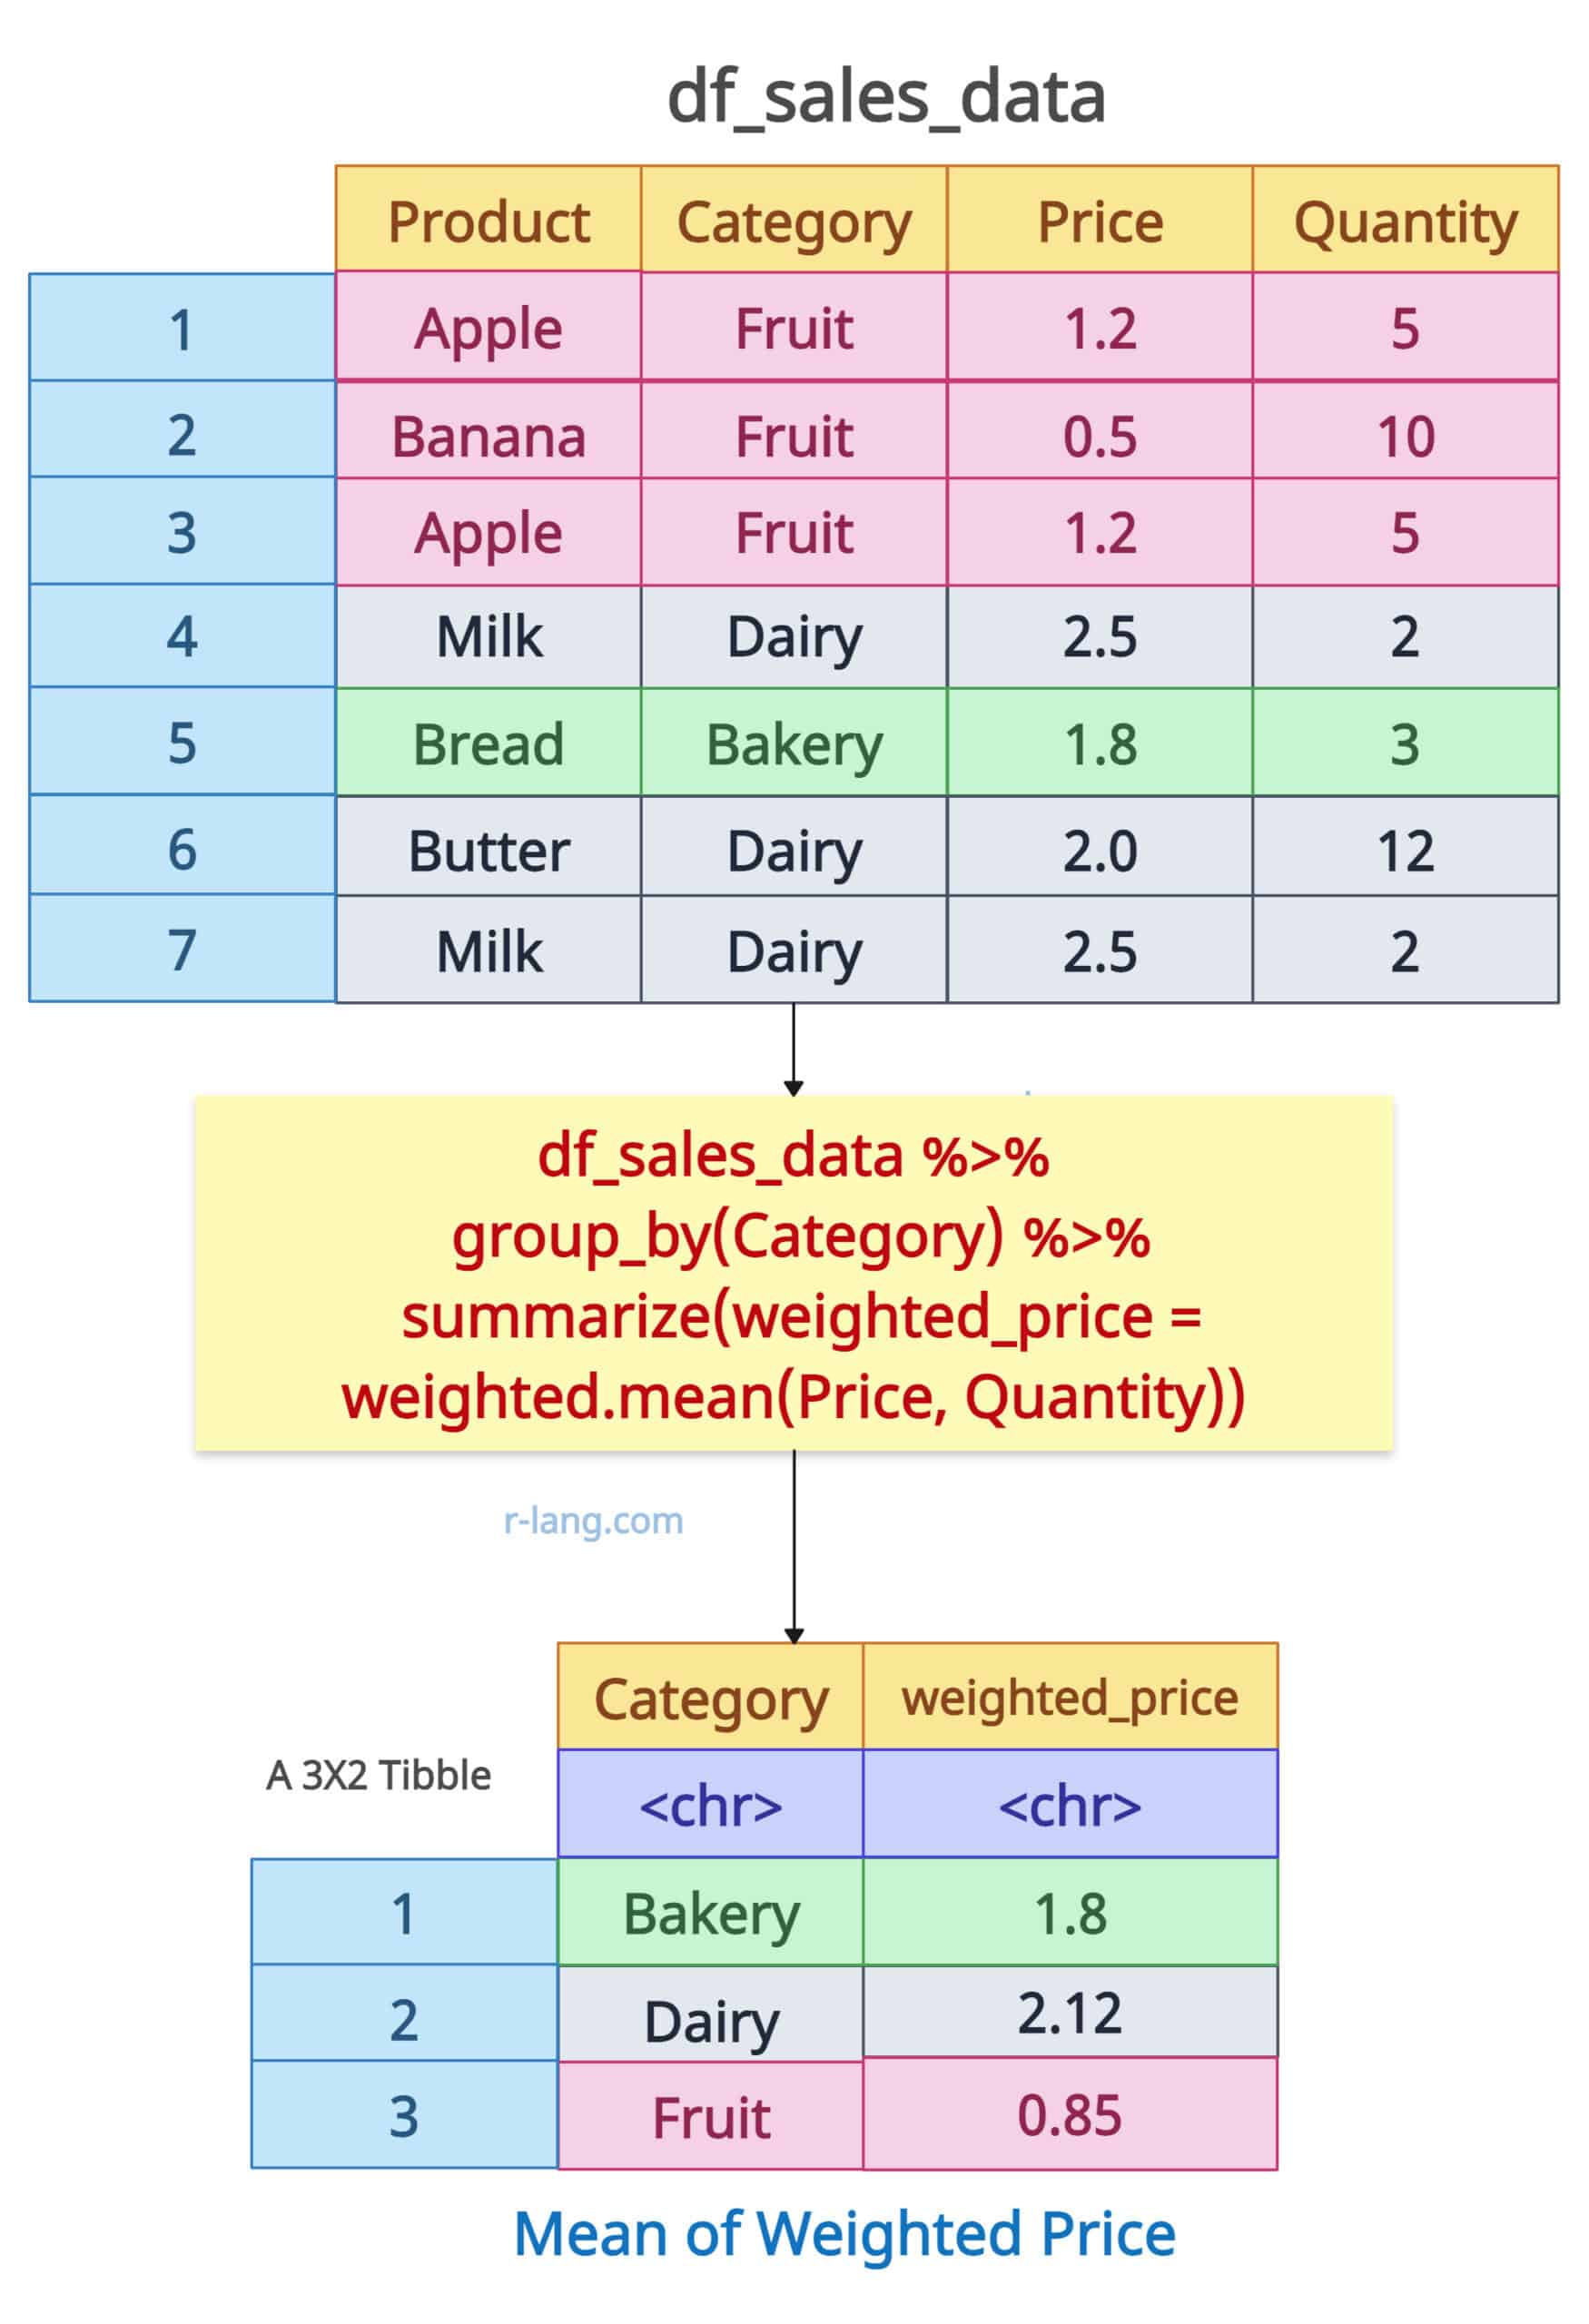
A weighted mean (also known as a weighted average) is a mean where some values contribute more significantly than others to the final result.
library(dplyr)


df_sales_data <- data.frame(
  Product = c("Apple", "Banana", "Apple", "Milk", "Bread", "Butter", "Milk"),
  Category = c("Fruit", "Fruit", "Fruit", "Dairy", "Bakery", "Dairy", "Dairy"),
  Price = c(1.2, 0.5, 1.2, 2.5, 1.8, 2.0, 2.5),
  Quantity = c(5, 10, 5, 2, 3, 12, 2),
  stringsAsFactors = FALSE
)

print(df_sales_data)

# Calculate weighted mean
df_sales_data %>%
  group_by(Category) %>%
  summarize(weighted_price = weighted.mean(Price, Quantity))
Output
Install the data.table package if you have not installed it already:
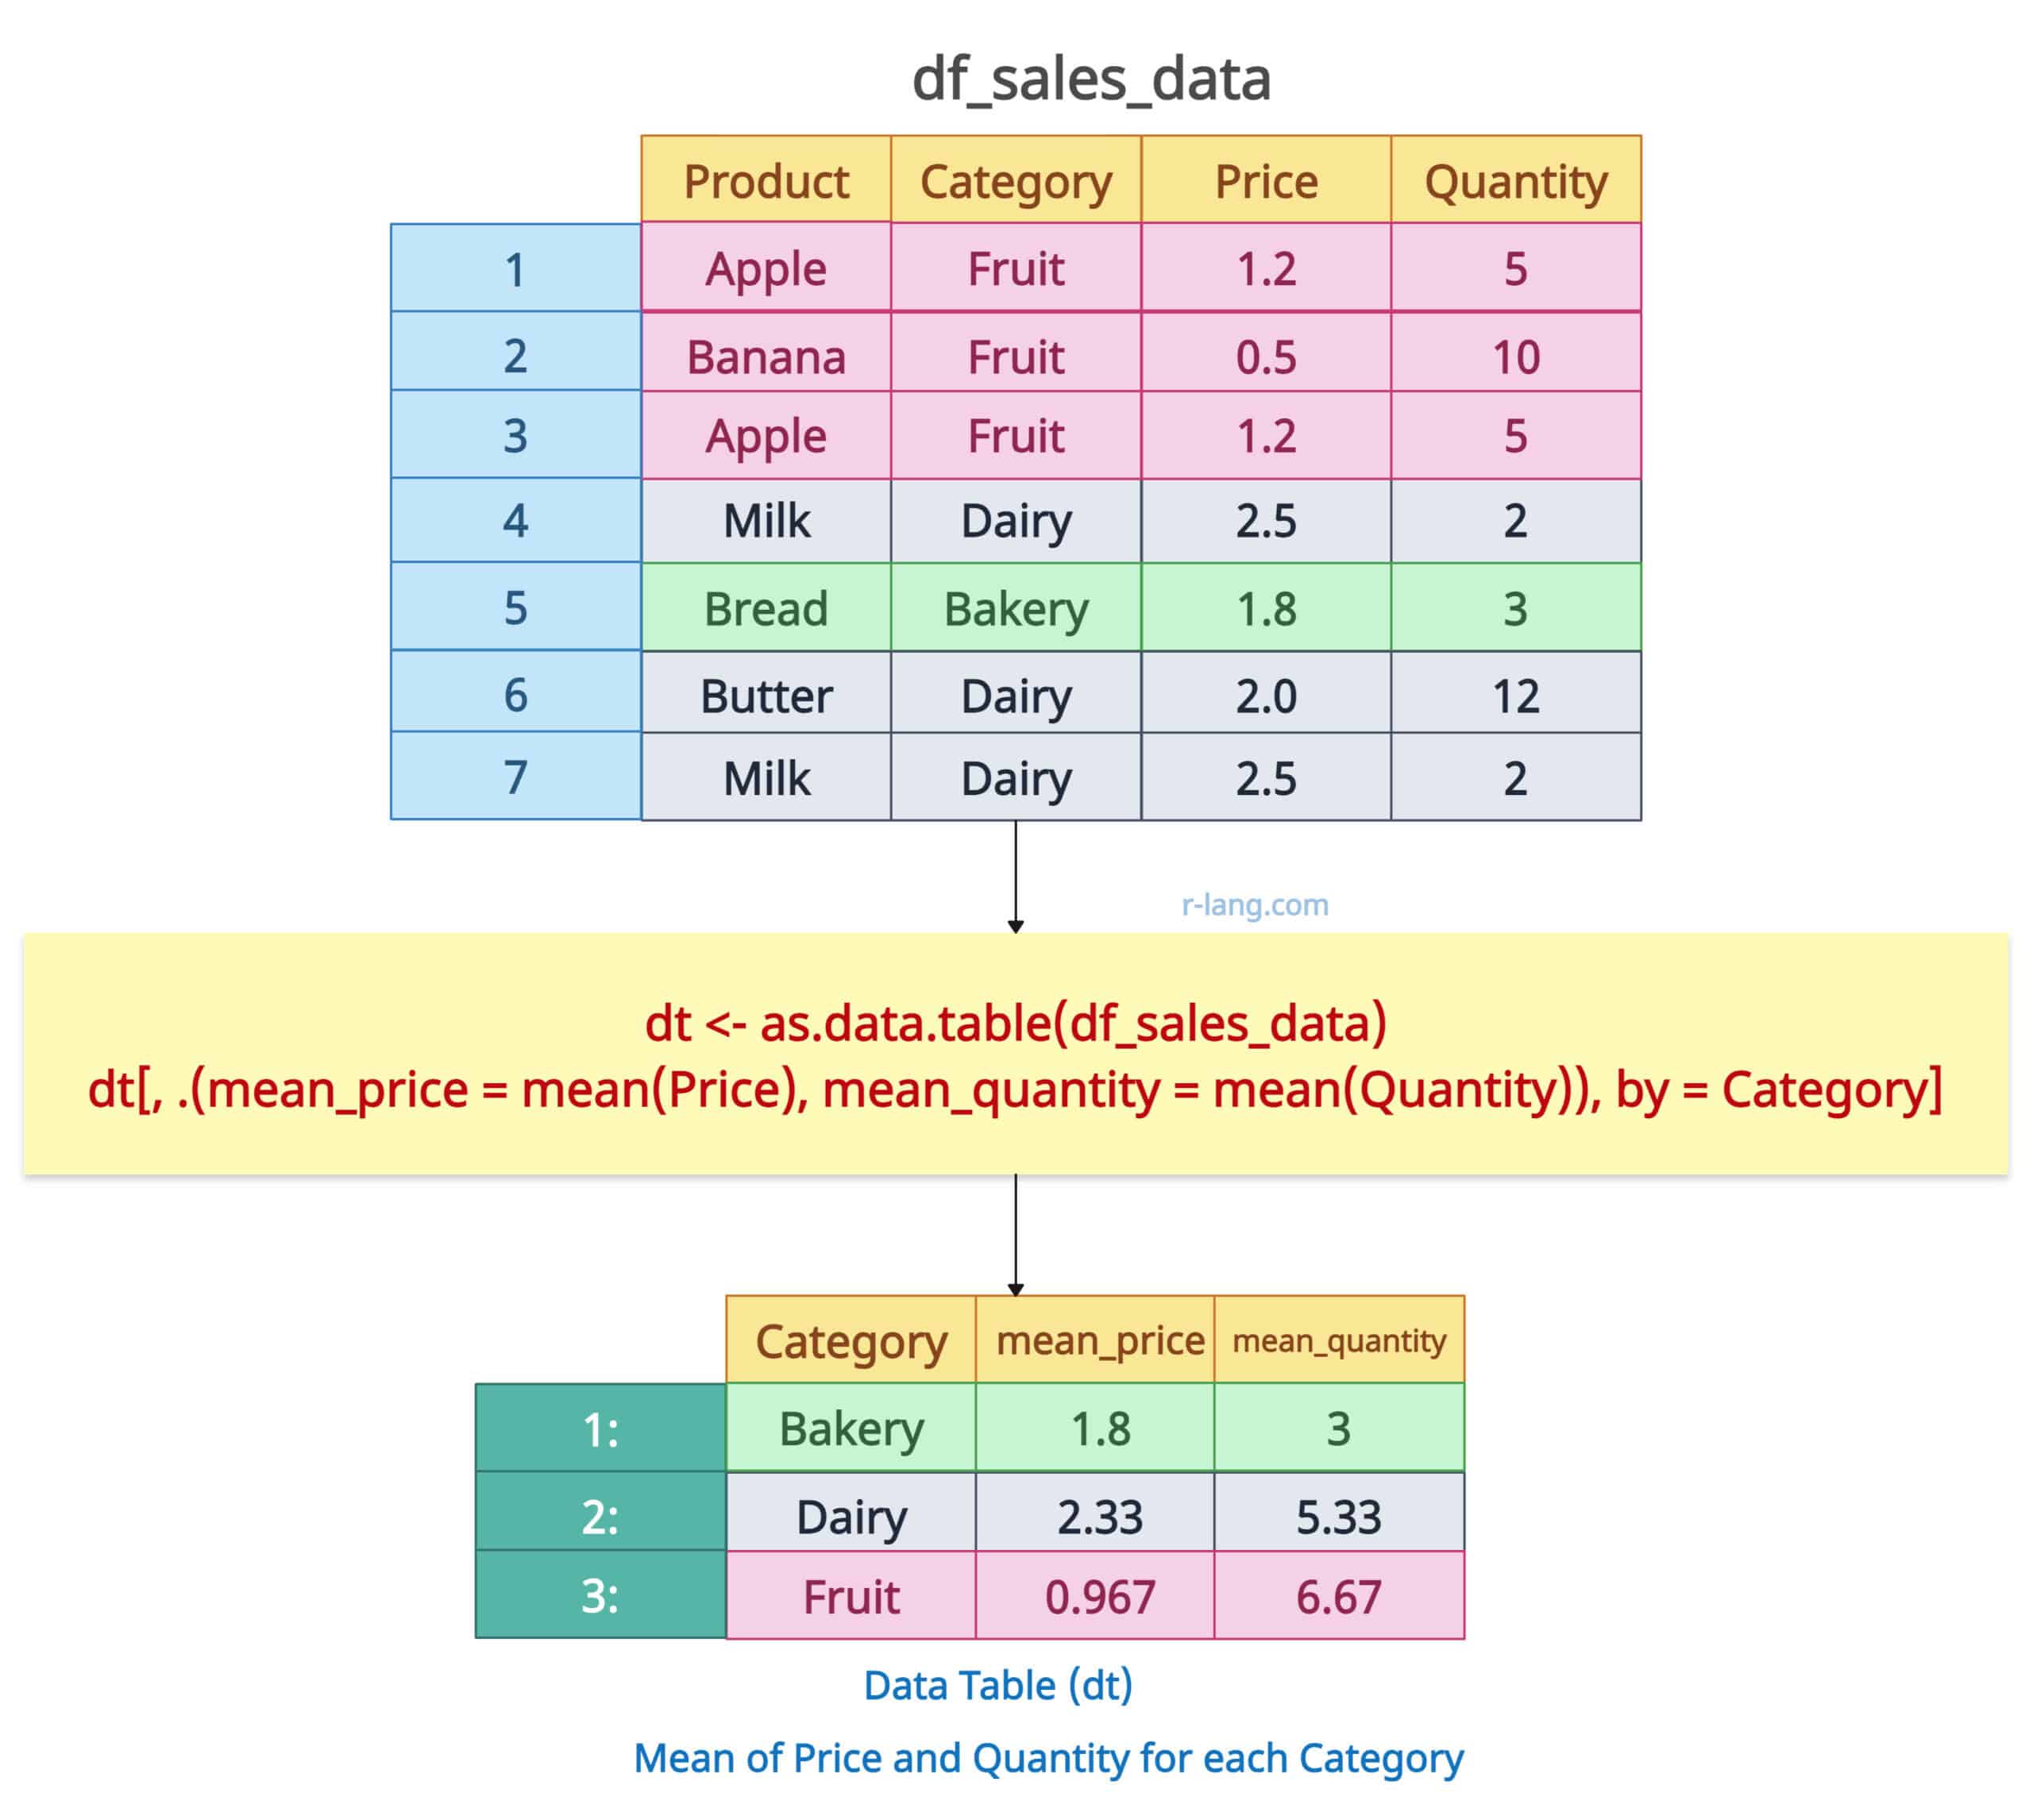
Let’s find the basic grouped mean of Price and Quantity by Category:
library(dplyr)


df_sales_data <- data.frame(
  Product = c("Apple", "Banana", "Apple", "Milk", "Bread", "Butter", "Milk"),
  Category = c("Fruit", "Fruit", "Fruit", "Dairy", "Bakery", "Dairy", "Dairy"),
  Price = c(1.2, 0.5, 1.2, 2.5, 1.8, 2.0, 2.5),
  Quantity = c(5, 10, 5, 2, 3, 12, 2),
  stringsAsFactors = FALSE
)

print(df_sales_data)

# Basic Grouped Mean using data.table
dt <- as.data.table(df_sales_data)
dt[, .(mean_price = mean(Price), mean_quantity = mean(Quantity)), by = Category]
Output
That’s all!
Krunal Lathiya is a seasoned Computer Science expert with over eight years in the tech industry. He boasts deep knowledge in Data Science and Machine Learning. Versed in Python, JavaScript, PHP, R, and Golang. Skilled in frameworks like Angular and React and platforms such as Node.js. His expertise spans both front-end and back-end development. His proficiency in the Python language stands as a testament to his versatility and commitment to the craft.
The scale() function in R centers (subtracting the mean) and/or scales (dividing by the standard…
To rename a file in R, you can use the file.rename() function. It renames a…
The prop.table() function in R calculates the proportion or relative frequency of values in a…
The exp() is a built-in function that calculates the exponential of its input, raising Euler's…
The split() function divides the input data into groups based on some criteria, typically specified…
The colMeans() function in R calculates the arithmetic mean of columns in a numeric matrix,…