
If you want to find the maximum value within a specific subset of your data, you must find the maximum value within each group.
First, group your data based on the values of one or more categorical variables (columns).
The second step is identifying the maximum value of a specific numeric variable (numeric column) for each group.
Here are three approaches to finding the maximum value by group:
- Using dplyr (Fast, readable, and user-friendly)
- Using base R (No dependencies, Moderate speed)
- Using data.table (Fastest and Most Efficient, but Learning Curve)
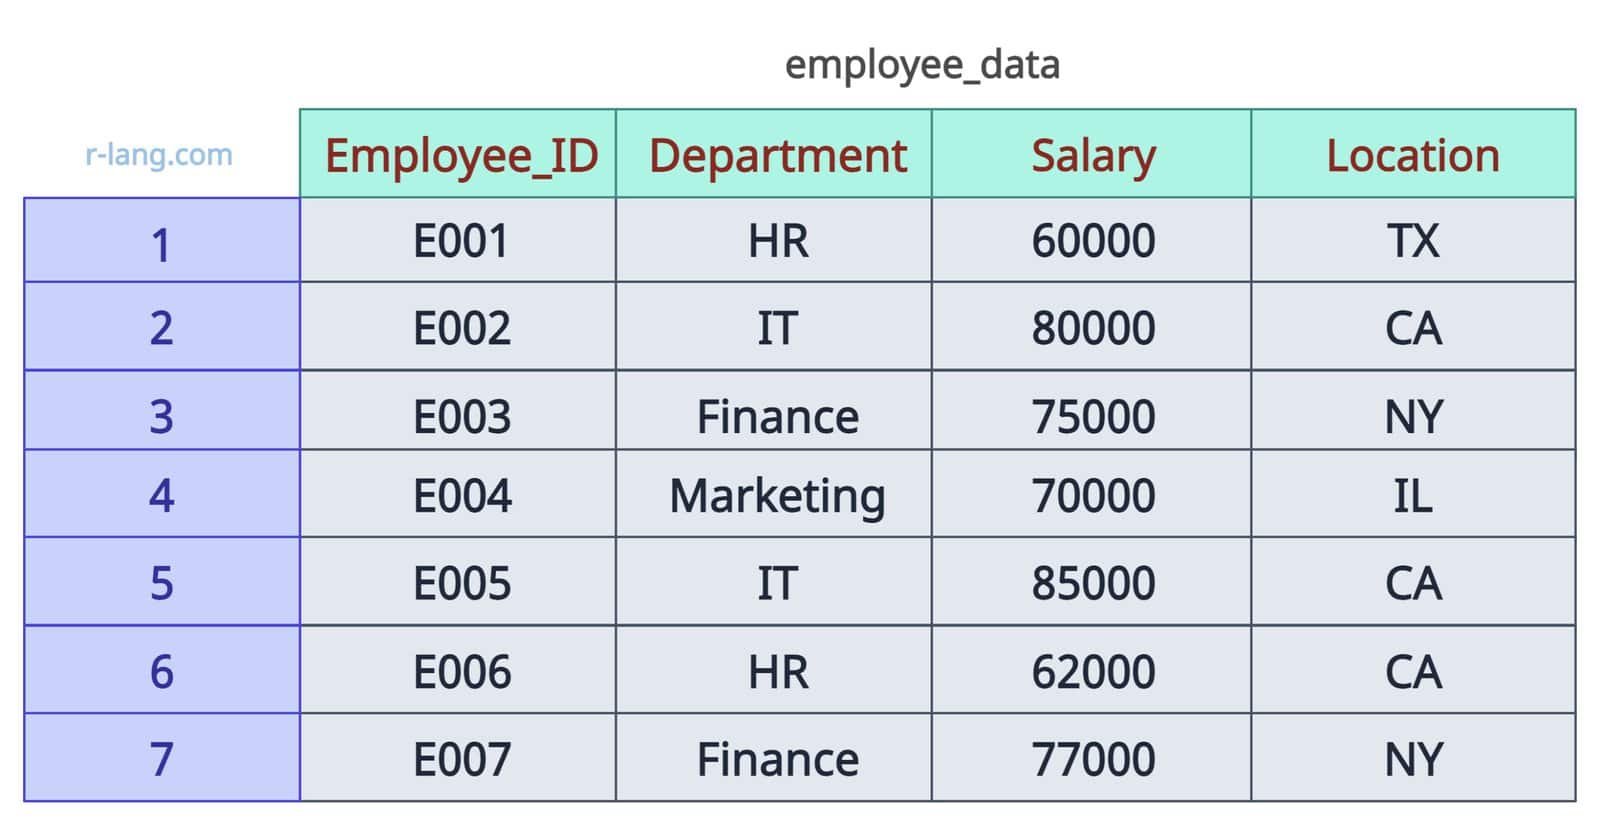
To illustrate the concepts in this tutorial, we use the following demo DataFrame, which is concise and robust for coding examples.
employee_data <- data.frame(
  Employee_ID = c("E001", "E002", "E003", "E004", "E005", "E006", "E007"),
  Department = c("HR", "IT", "Finance", "Marketing", "IT", "HR", "Finance"),
  Salary = c(60000, 80000, 75000, 70000, 85000, 62000, 77000),
  Location = c("TX", "CA", "NY", "IL", "CA", "CA", "NY")
)

print(employee_data)
Method 1: Using dplyr
Using dplyr is efficient because its main function is to modify the data frame meaningfully to get the desired output.
It provides a group_by() function to group the data into multiple subsets based on the value of one or more columns. Then, we can use the summarise() function to find the maximum value in each subgroup.
Single group
Let’s get the maximum Salary by Department:
library(dplyr)

employee_data <- data.frame(
  Employee_ID = c("E001", "E002", "E003", "E004", "E005", "E006", "E007"),
  Department = c("HR", "IT", "Finance", "Marketing", "IT", "HR", "Finance"),
  Salary = c(60000, 80000, 75000, 70000, 85000, 62000, 77000),
  Location = c("TX", "CA", "NY", "IL", "CA", "CA", "NY")
)

print(employee_data)

# Using dplyr
# Maximum salary per single group
employee_data %>%
  group_by(Department) %>%
  summarize(max_salary = max(Salary))
Output
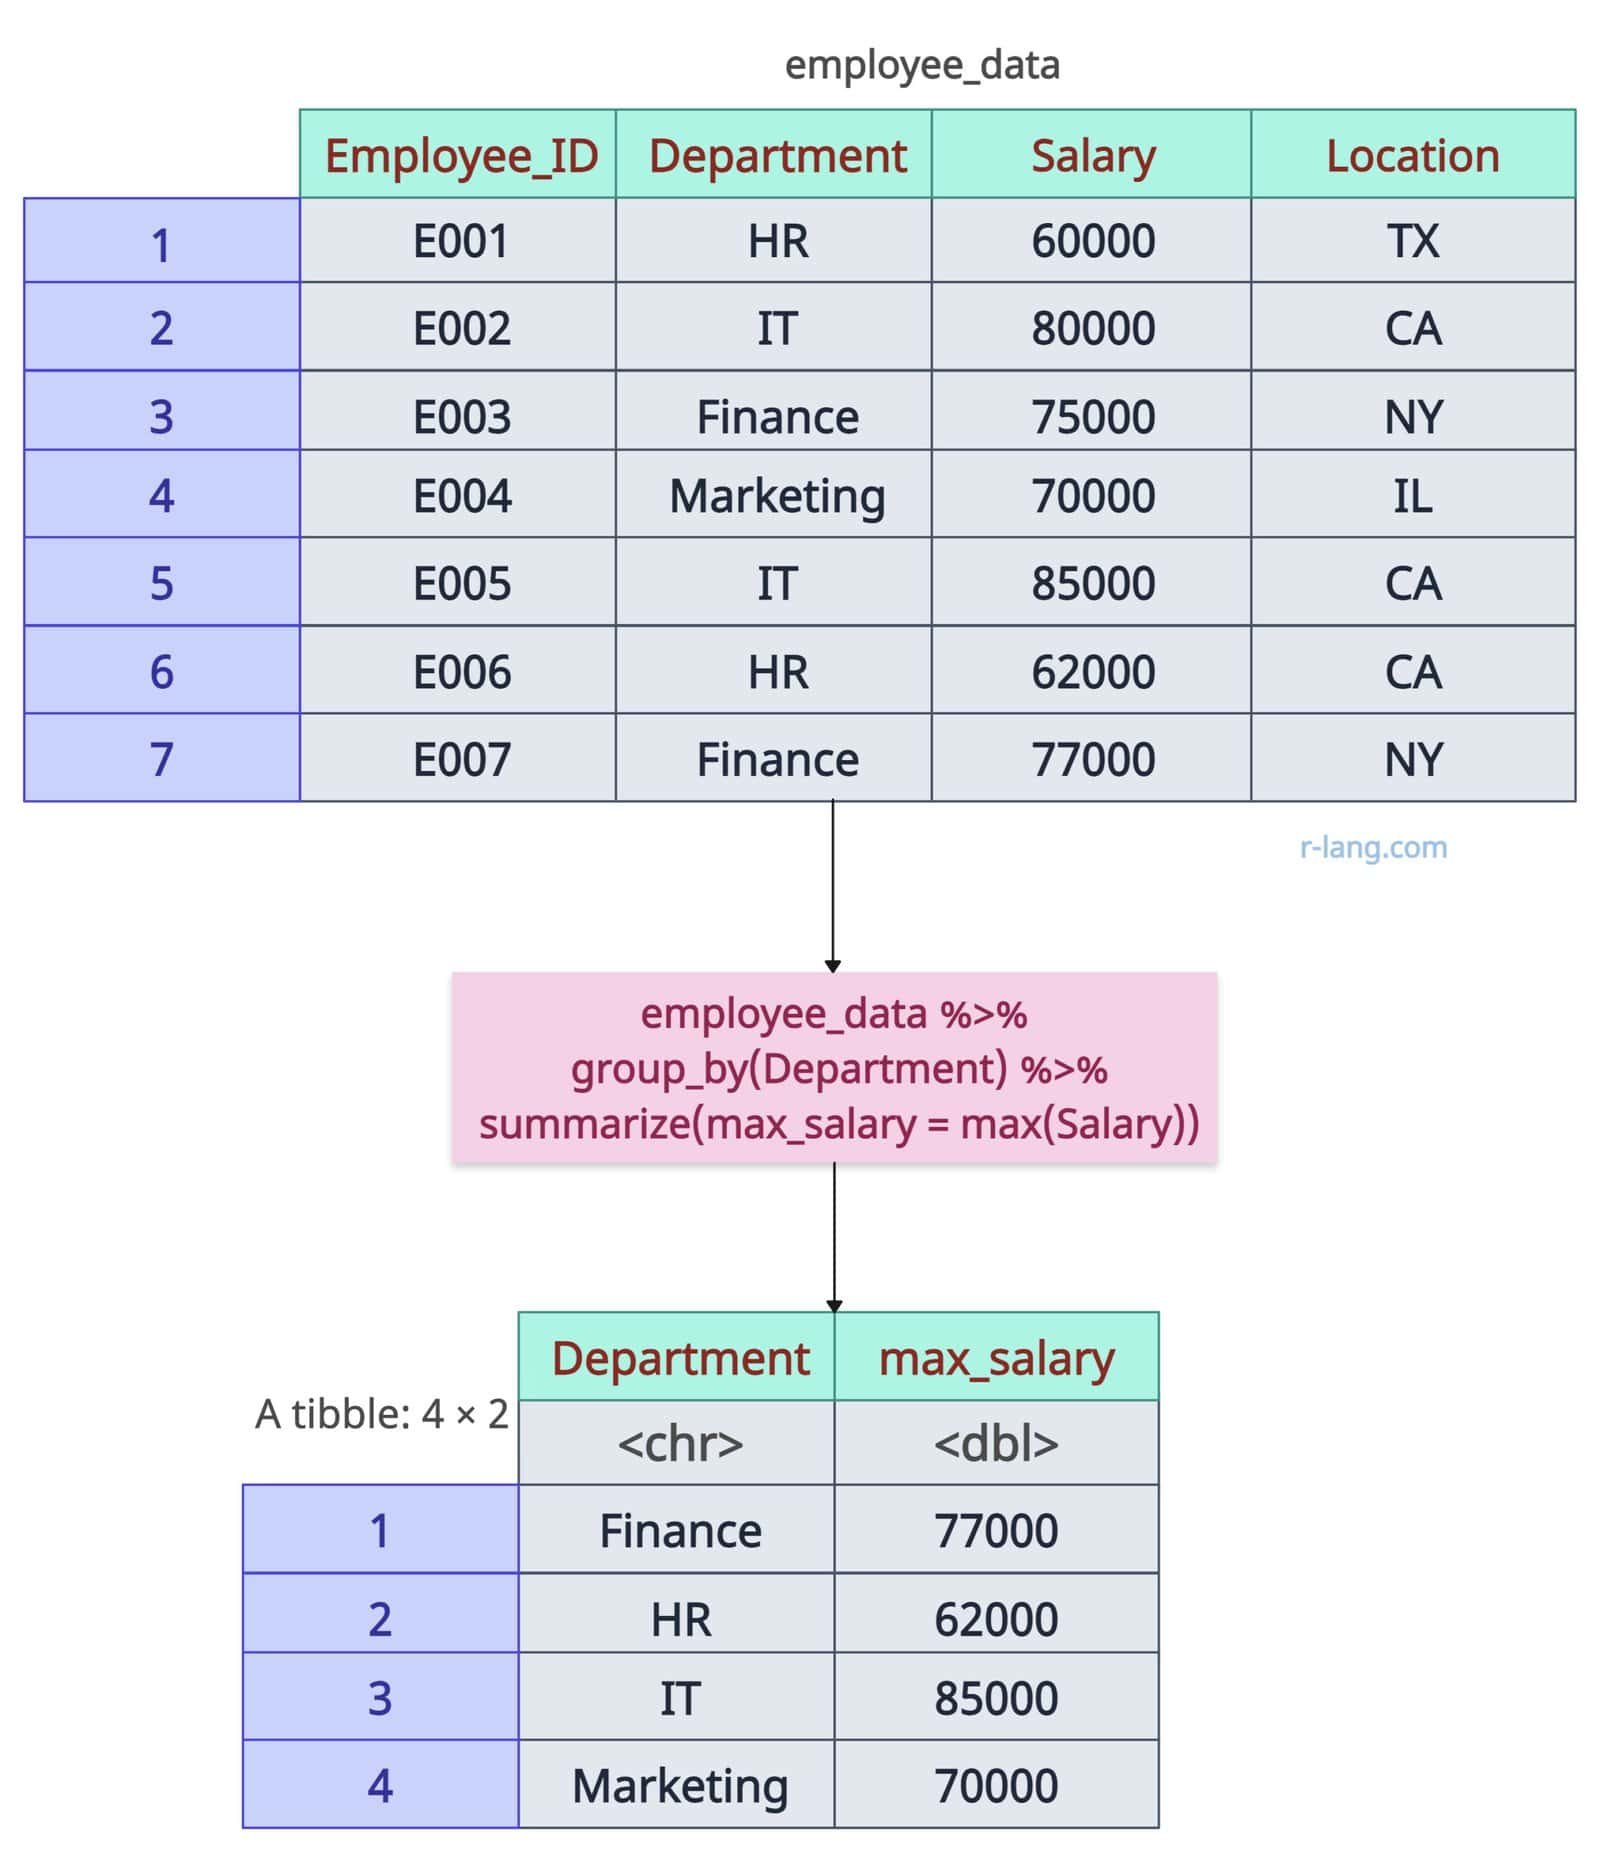
The above output figure shows a tibble of four rows and two columns. The Department is a categorical column containing unique department names; the next column is max_salary, which represents the maximum Salary for each Department.
Multiple groups
Let’s find the maximum Salary by Department (group 1) and location (group 2):
library(dplyr)

employee_data <- data.frame(
  Employee_ID = c("E001", "E002", "E003", "E004", "E005", "E006", "E007"),
  Department = c("HR", "IT", "Finance", "Marketing", "IT", "HR", "Finance"),
  Salary = c(60000, 80000, 75000, 70000, 85000, 62000, 77000),
  Location = c("TX", "CA", "NY", "IL", "CA", "CA", "NY")
)

print(employee_data)

# Maximum value by multiple groups
employee_data %>%
  group_by(Department, Location) %>%
  summarize(max_salary = max(Salary))
Output
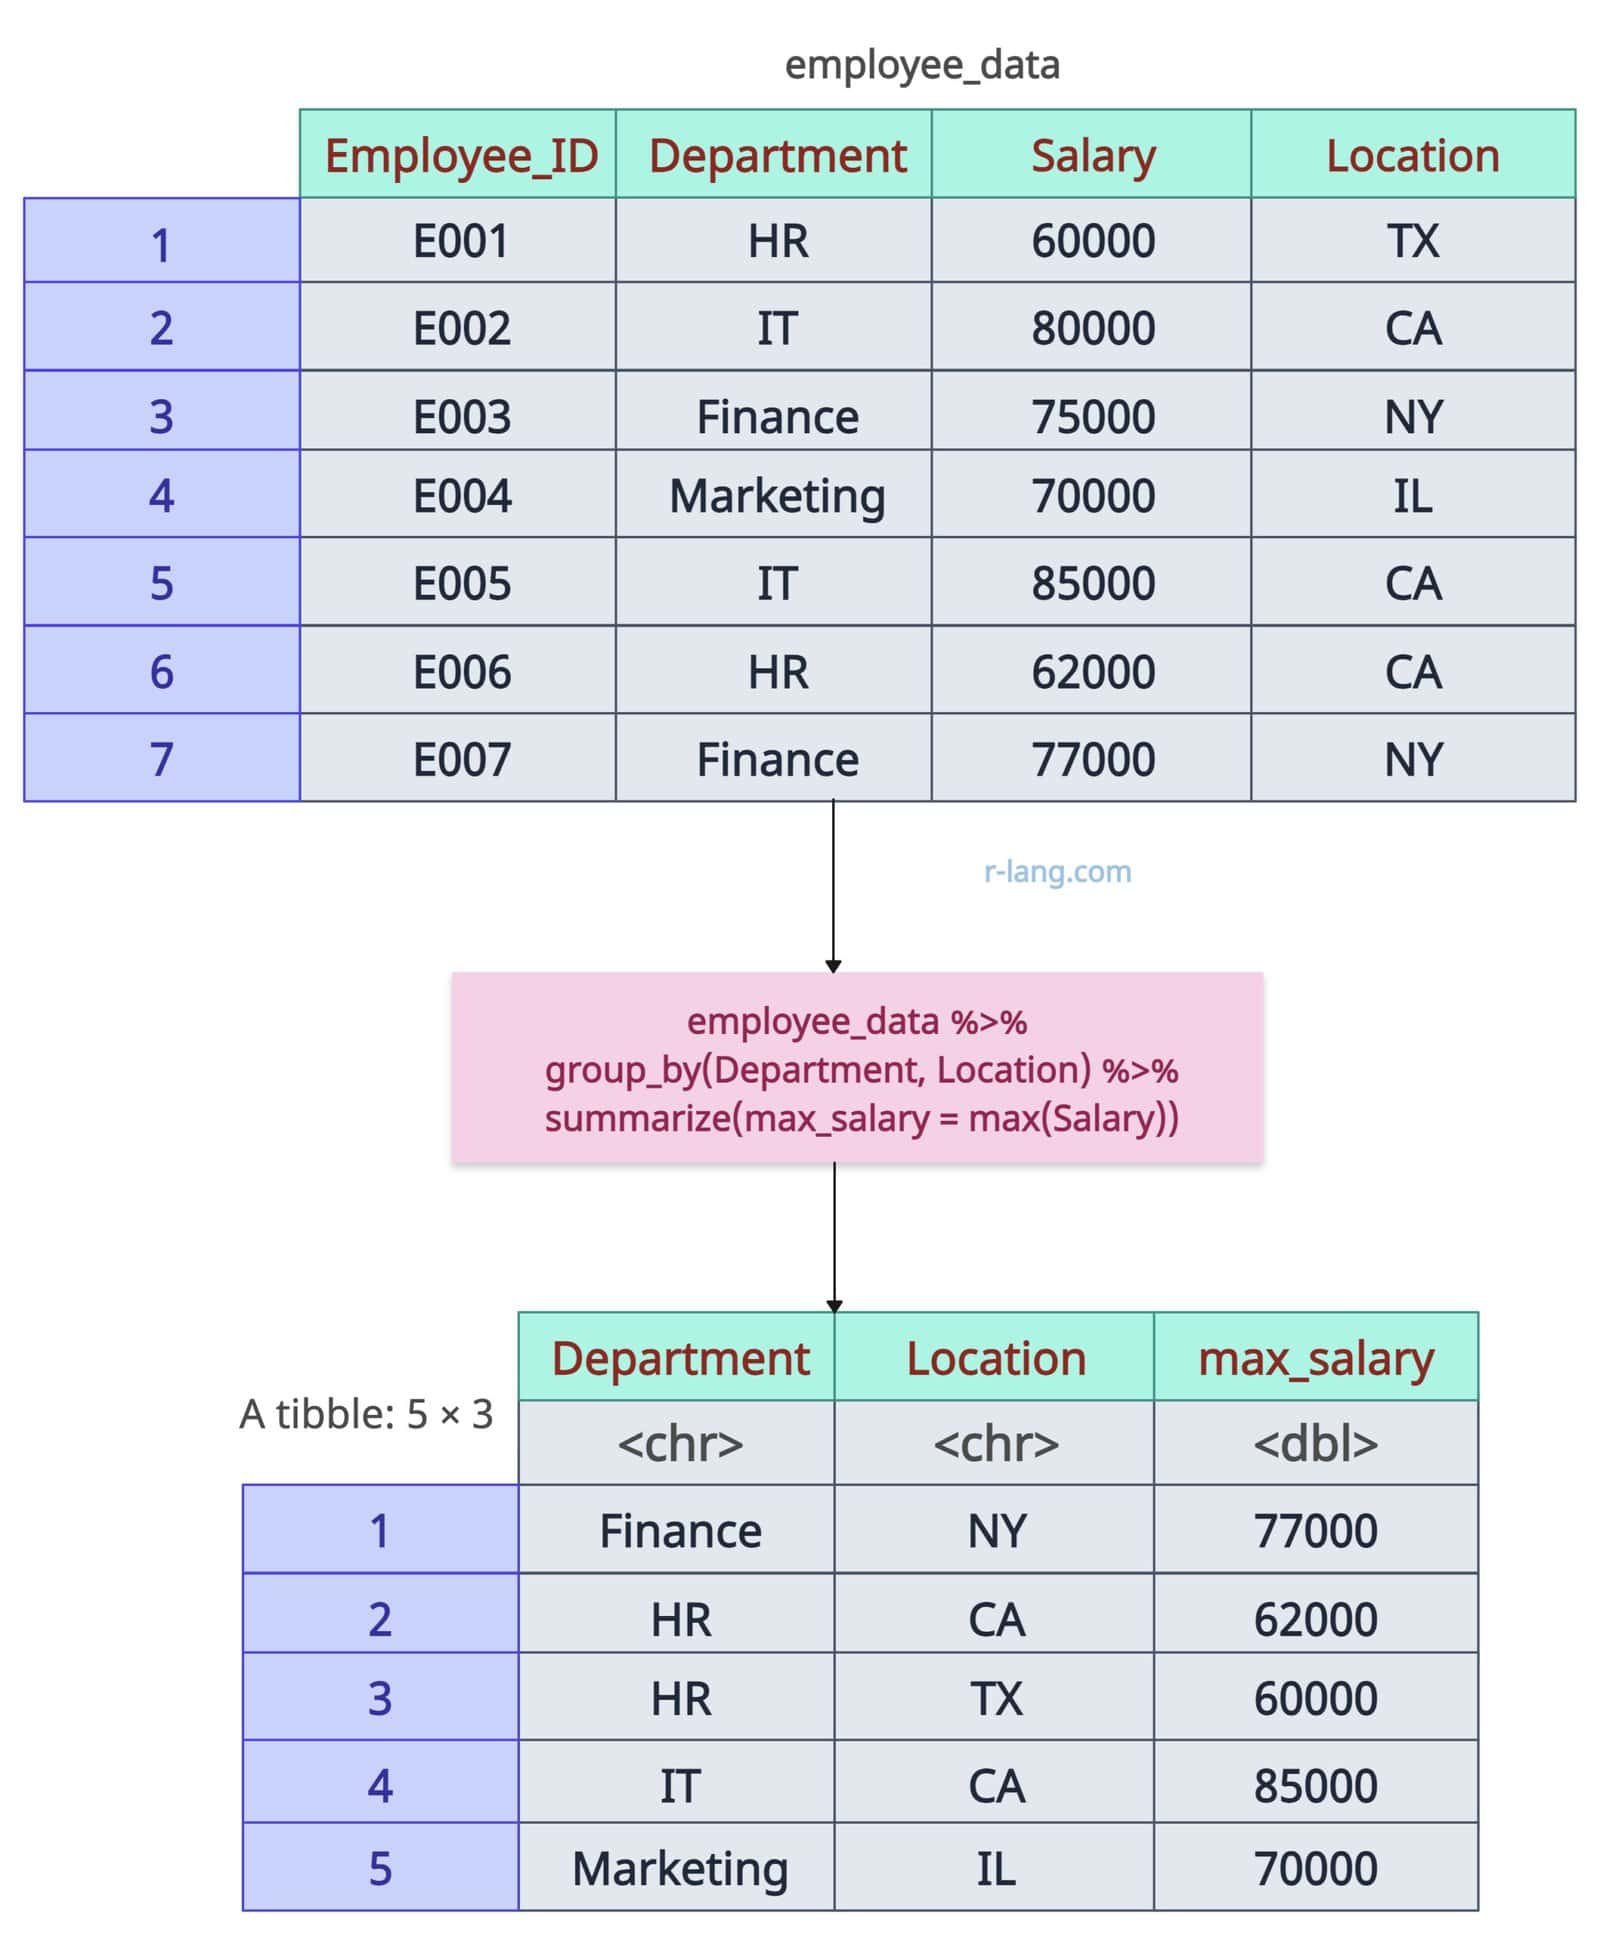
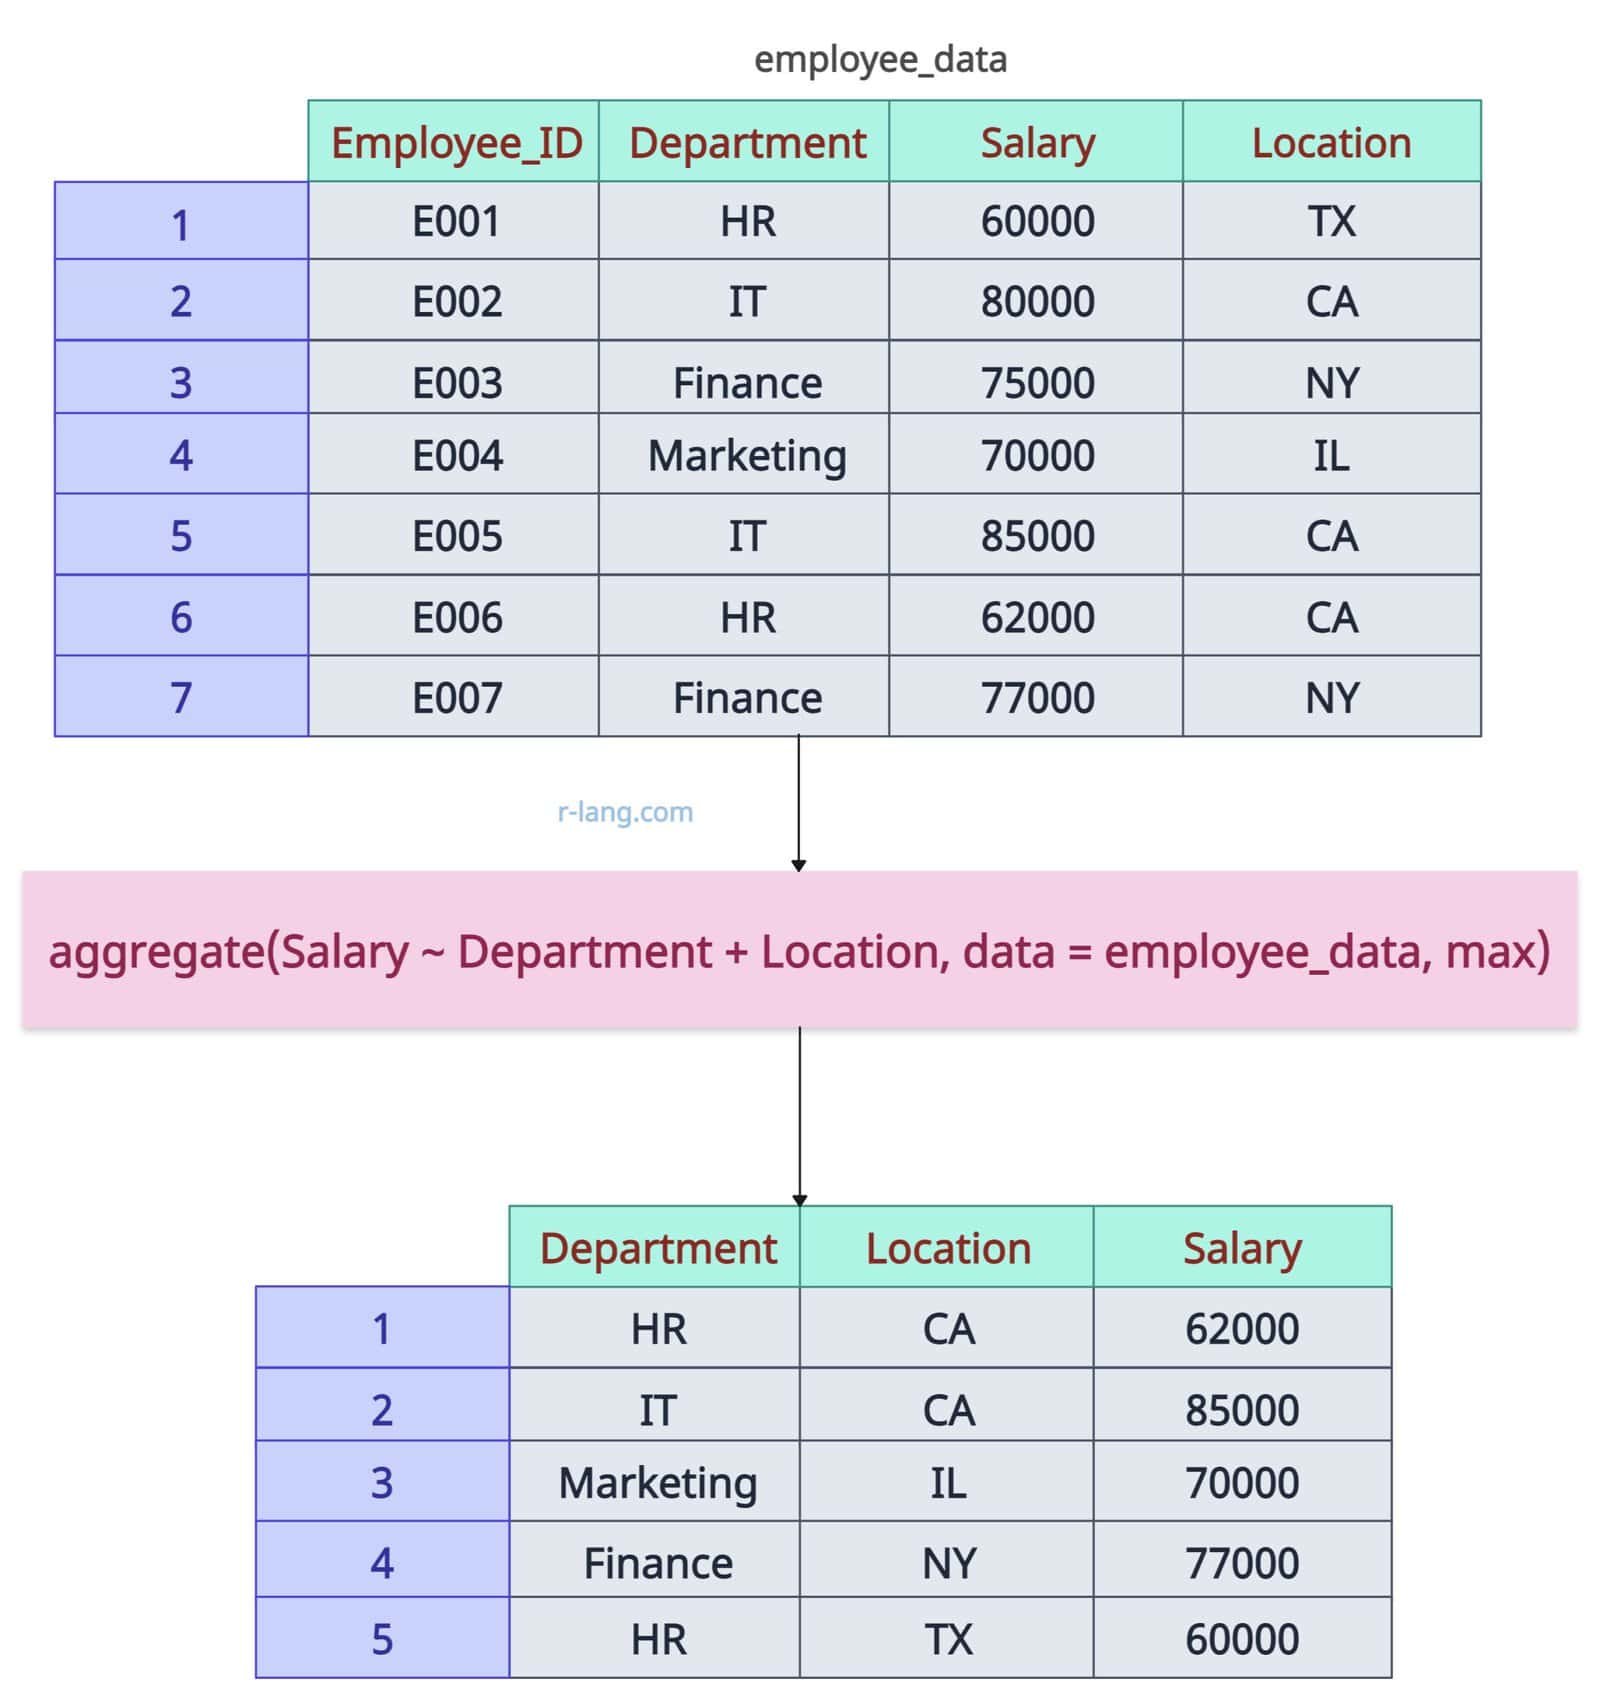
When you combine multiple groups, R creates unique combinations of these groups (Department and Location) based on the max_salary for each subset.
A group with no data (e.g., Sales) will be omitted by default. To retain empty groups, use .drop = FALSE in the group_by() method.
Single row with the maximum value across all the columns
Using dplyr’s slice_max() function, you can find the maximum value of Salary, and it will return the complete row containing that Salary.
library(dplyr)

employee_data <- data.frame(
  Employee_ID = c("E001", "E002", "E003", "E004", "E005", "E006", "E007"),
  Department = c("HR", "IT", "Finance", "Marketing", "IT", "HR", "Finance"),
  Salary = c(60000, 80000, 75000, 70000, 85000, 62000, 77000),
  Location = c("TX", "CA", "NY", "IL", "CA", "CA", "NY")
)

print(employee_data)

# Maximum value across all columns
employee_data %>%
  slice_max(Salary, n = 1)
Output
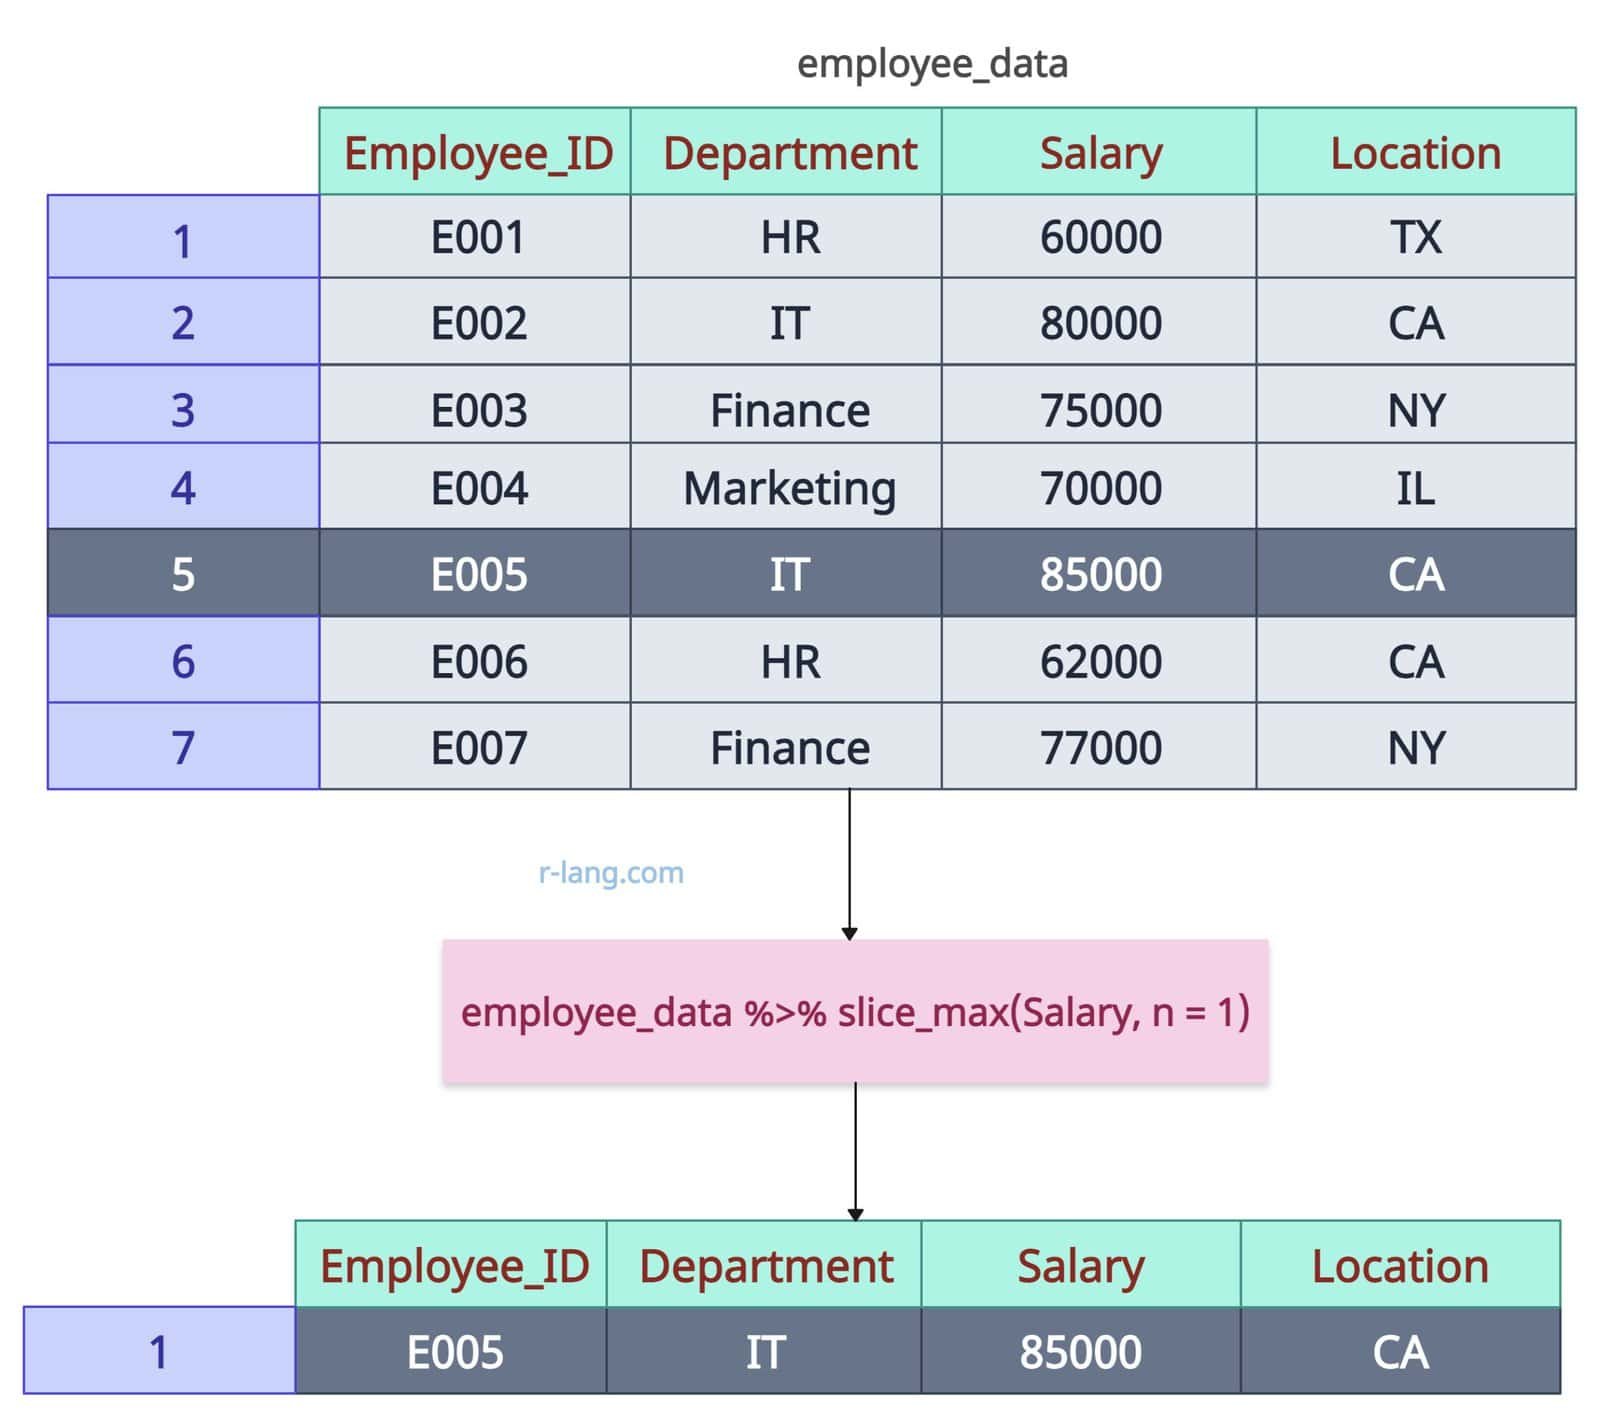
If two employees in the same Department have the same maximum Salary, use the slice_max(Salary, n = Inf) function with n = Inf to return all ties.
Method 2: Using base R
When it comes to base R, the aggregate() function is the most popular for grouping data and applying a function, such as max. You don’t need any third-party package to use it.
Get the maximum Salary per Department
employee_data <- data.frame(
  Employee_ID = c("E001", "E002", "E003", "E004", "E005", "E006", "E007"),
  Department = c("HR", "IT", "Finance", "Marketing", "IT", "HR", "Finance"),
  Salary = c(60000, 80000, 75000, 70000, 85000, 62000, 77000),
  Location = c("TX", "CA", "NY", "IL", "CA", "CA", "NY")
)

# Get maximum salary per group
aggregate(Salary ~ Department, data = employee_data, max)
Output
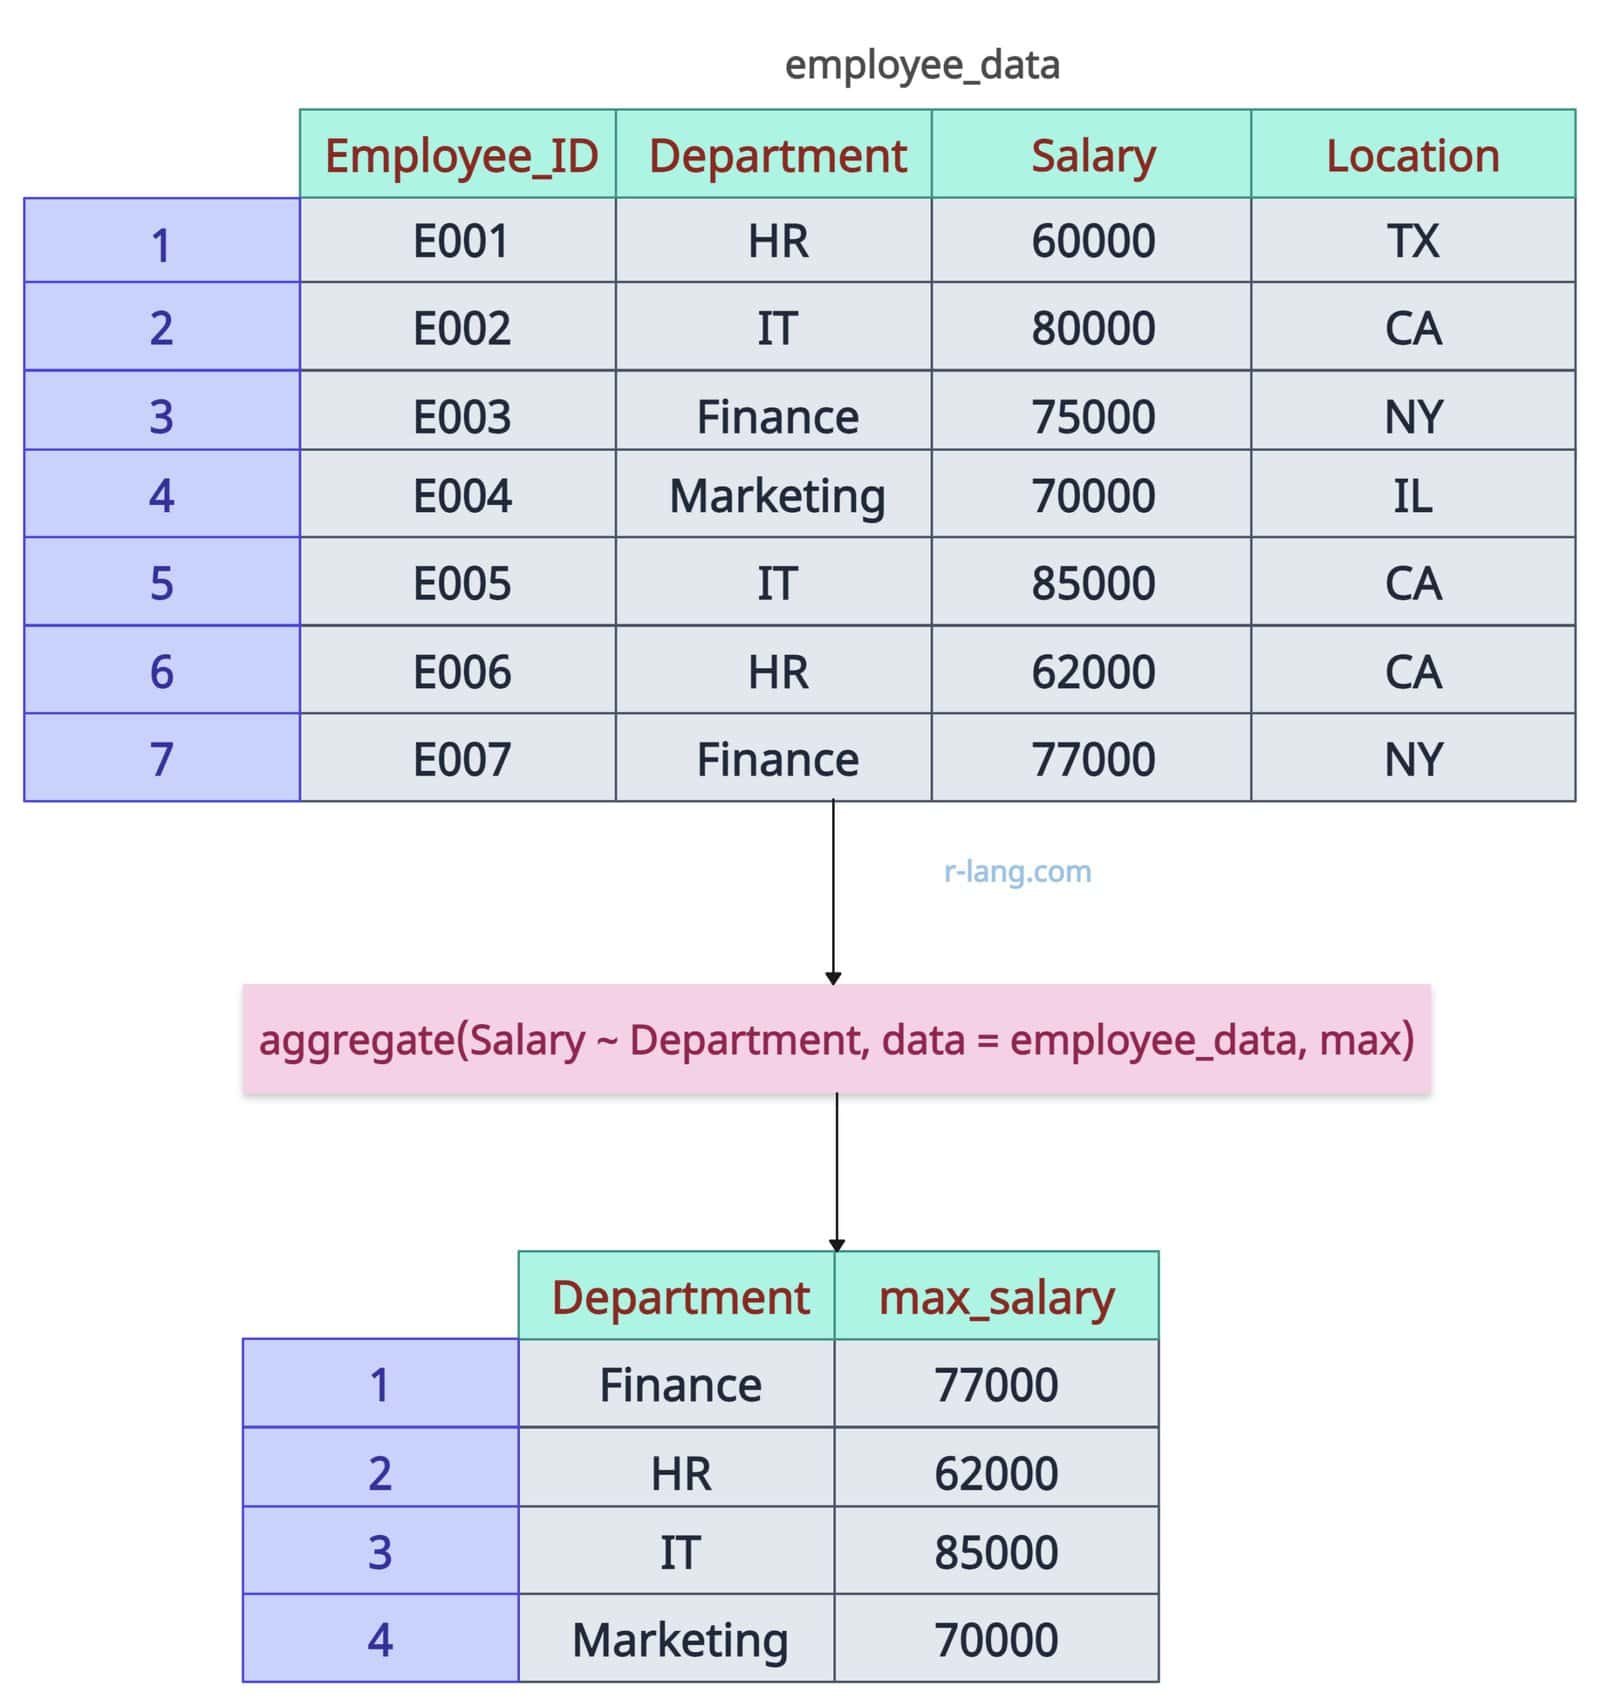 In this code, we pass ‘Department’ as a grouping variable for subsetting the data frame, ’employee_data’ as the data, and the ‘max()‘ function to retrieve the maximum value from each subset.
Get maximum value by multiple groups
employee_data <- data.frame(
  Employee_ID = c("E001", "E002", "E003", "E004", "E005", "E006", "E007"),
  Department = c("HR", "IT", "Finance", "Marketing", "IT", "HR", "Finance"),
  Salary = c(60000, 80000, 75000, 70000, 85000, 62000, 77000),
  Location = c("TX", "CA", "NY", "IL", "CA", "CA", "NY")
)

print(employee_data)

# Get maximum value by multiple groups
aggregate(Salary ~ Department + Location, data = employee_data, max)
Output
 Get the absolute maximum value across all columns
employee_data <- data.frame(
  Employee_ID = c("E001", "E002", "E003", "E004", "E005", "E006", "E007"),
  Department = c("HR", "IT", "Finance", "Marketing", "IT", "HR", "Finance"),
  Salary = c(60000, 80000, 75000, 70000, 85000, 62000, 77000),
  Location = c("TX", "CA", "NY", "IL", "CA", "CA", "NY")
)

print(employee_data)

# Get absolute maximum value across all columns
employee_data[which.max(employee_data$Salary), ]
Output
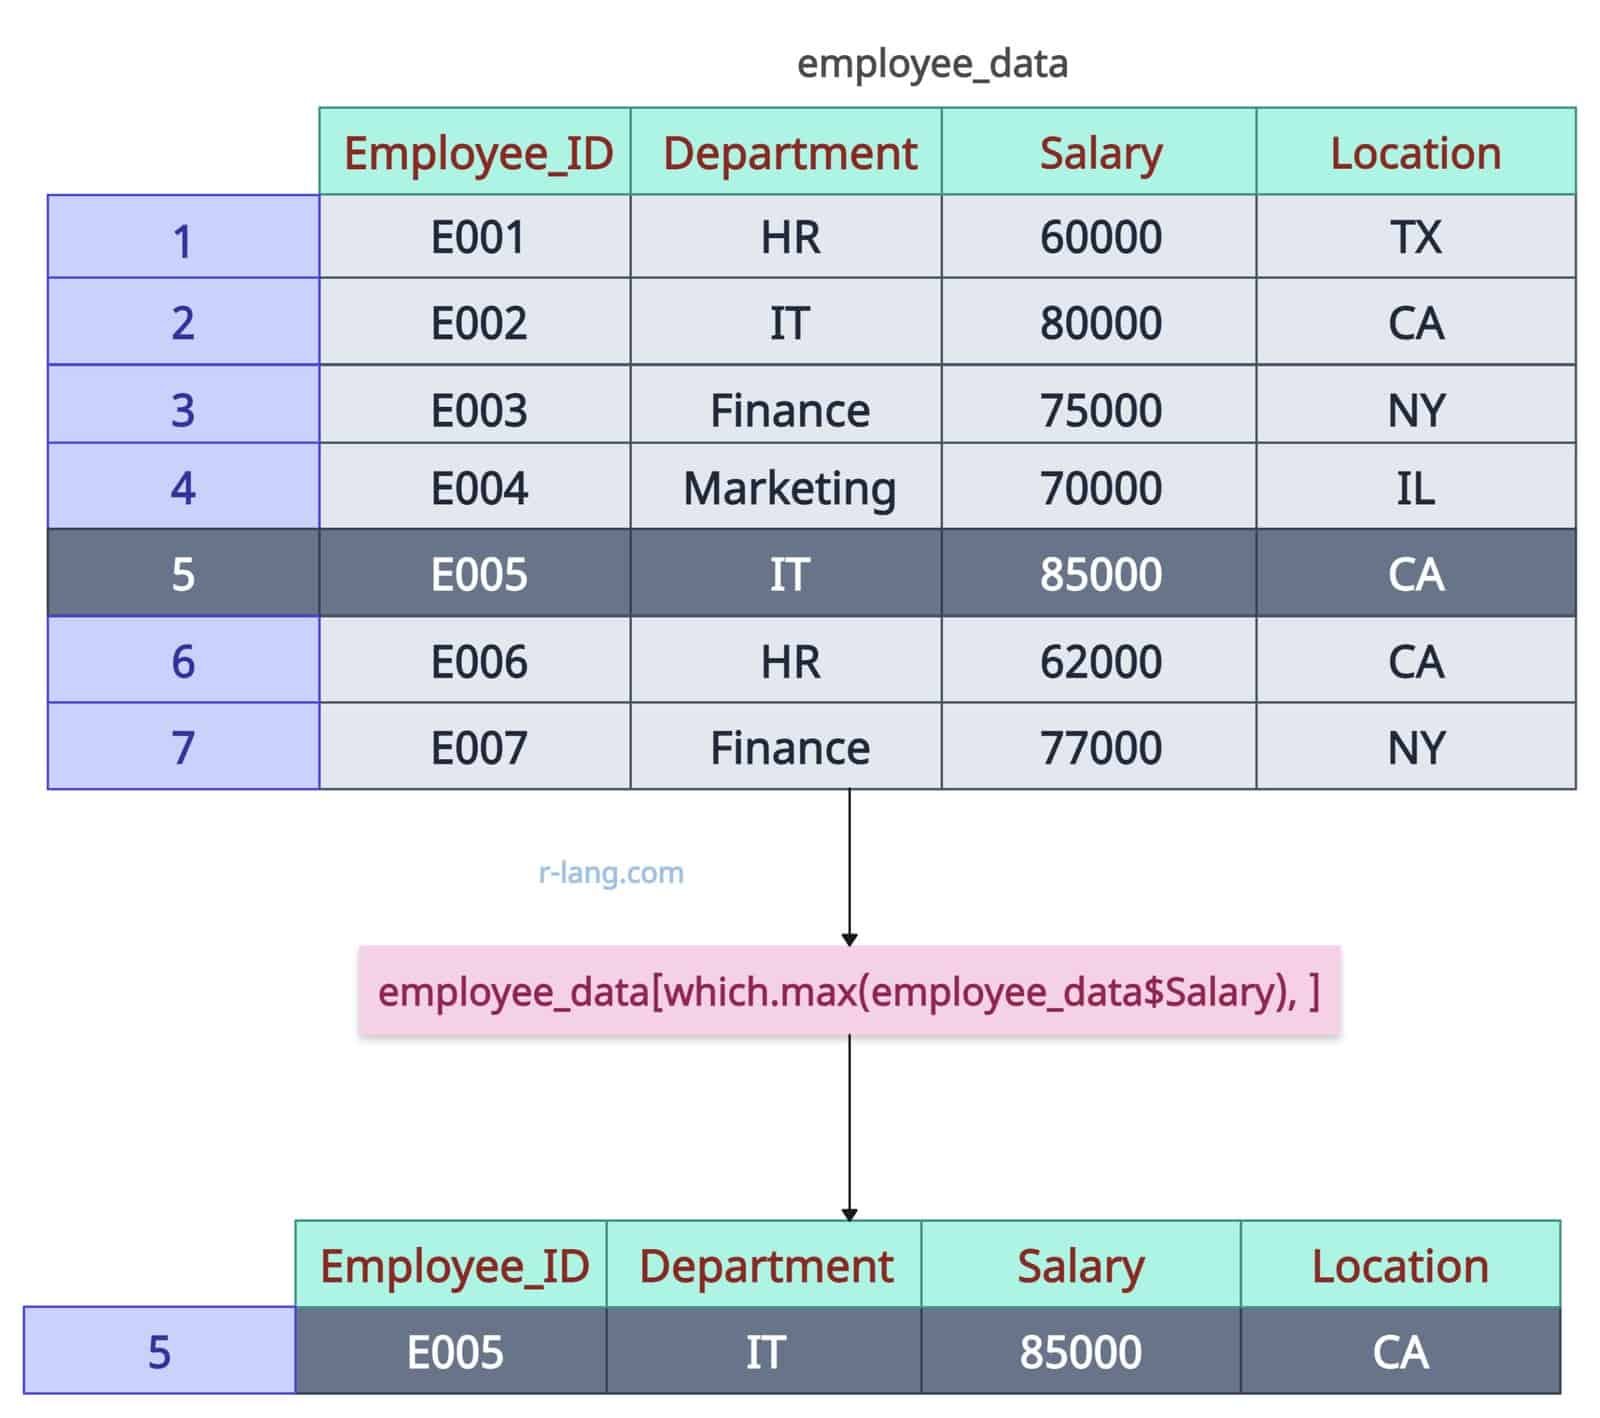
The above output shows that row 5 has the highest Salary of 85000, Department IT, Location CA, and Employee_ID E005.
Method 3: Using data.table
The data.table is highly efficient when you have a large dataset. First, you need to convert the input data frame into a data.table and then you can use its functions to get the maximum value by group(s).
Finding the maximum Salary per Department
library(data.table)

employee_data <- data.frame(
  Employee_ID = c("E001", "E002", "E003", "E004", "E005", "E006", "E007"),
  Department = c("HR", "IT", "Finance", "Marketing", "IT", "HR", "Finance"),
  Salary = c(60000, 80000, 75000, 70000, 85000, 62000, 77000),
  Location = c("TX", "CA", "NY", "IL", "CA", "CA", "NY")
)

print(employee_data)

employee_data_dt <- data.table(employee_data)

# Maximum salary per group
employee_data_dt[, .(max_salary = max(Salary)), by = Department]
Output
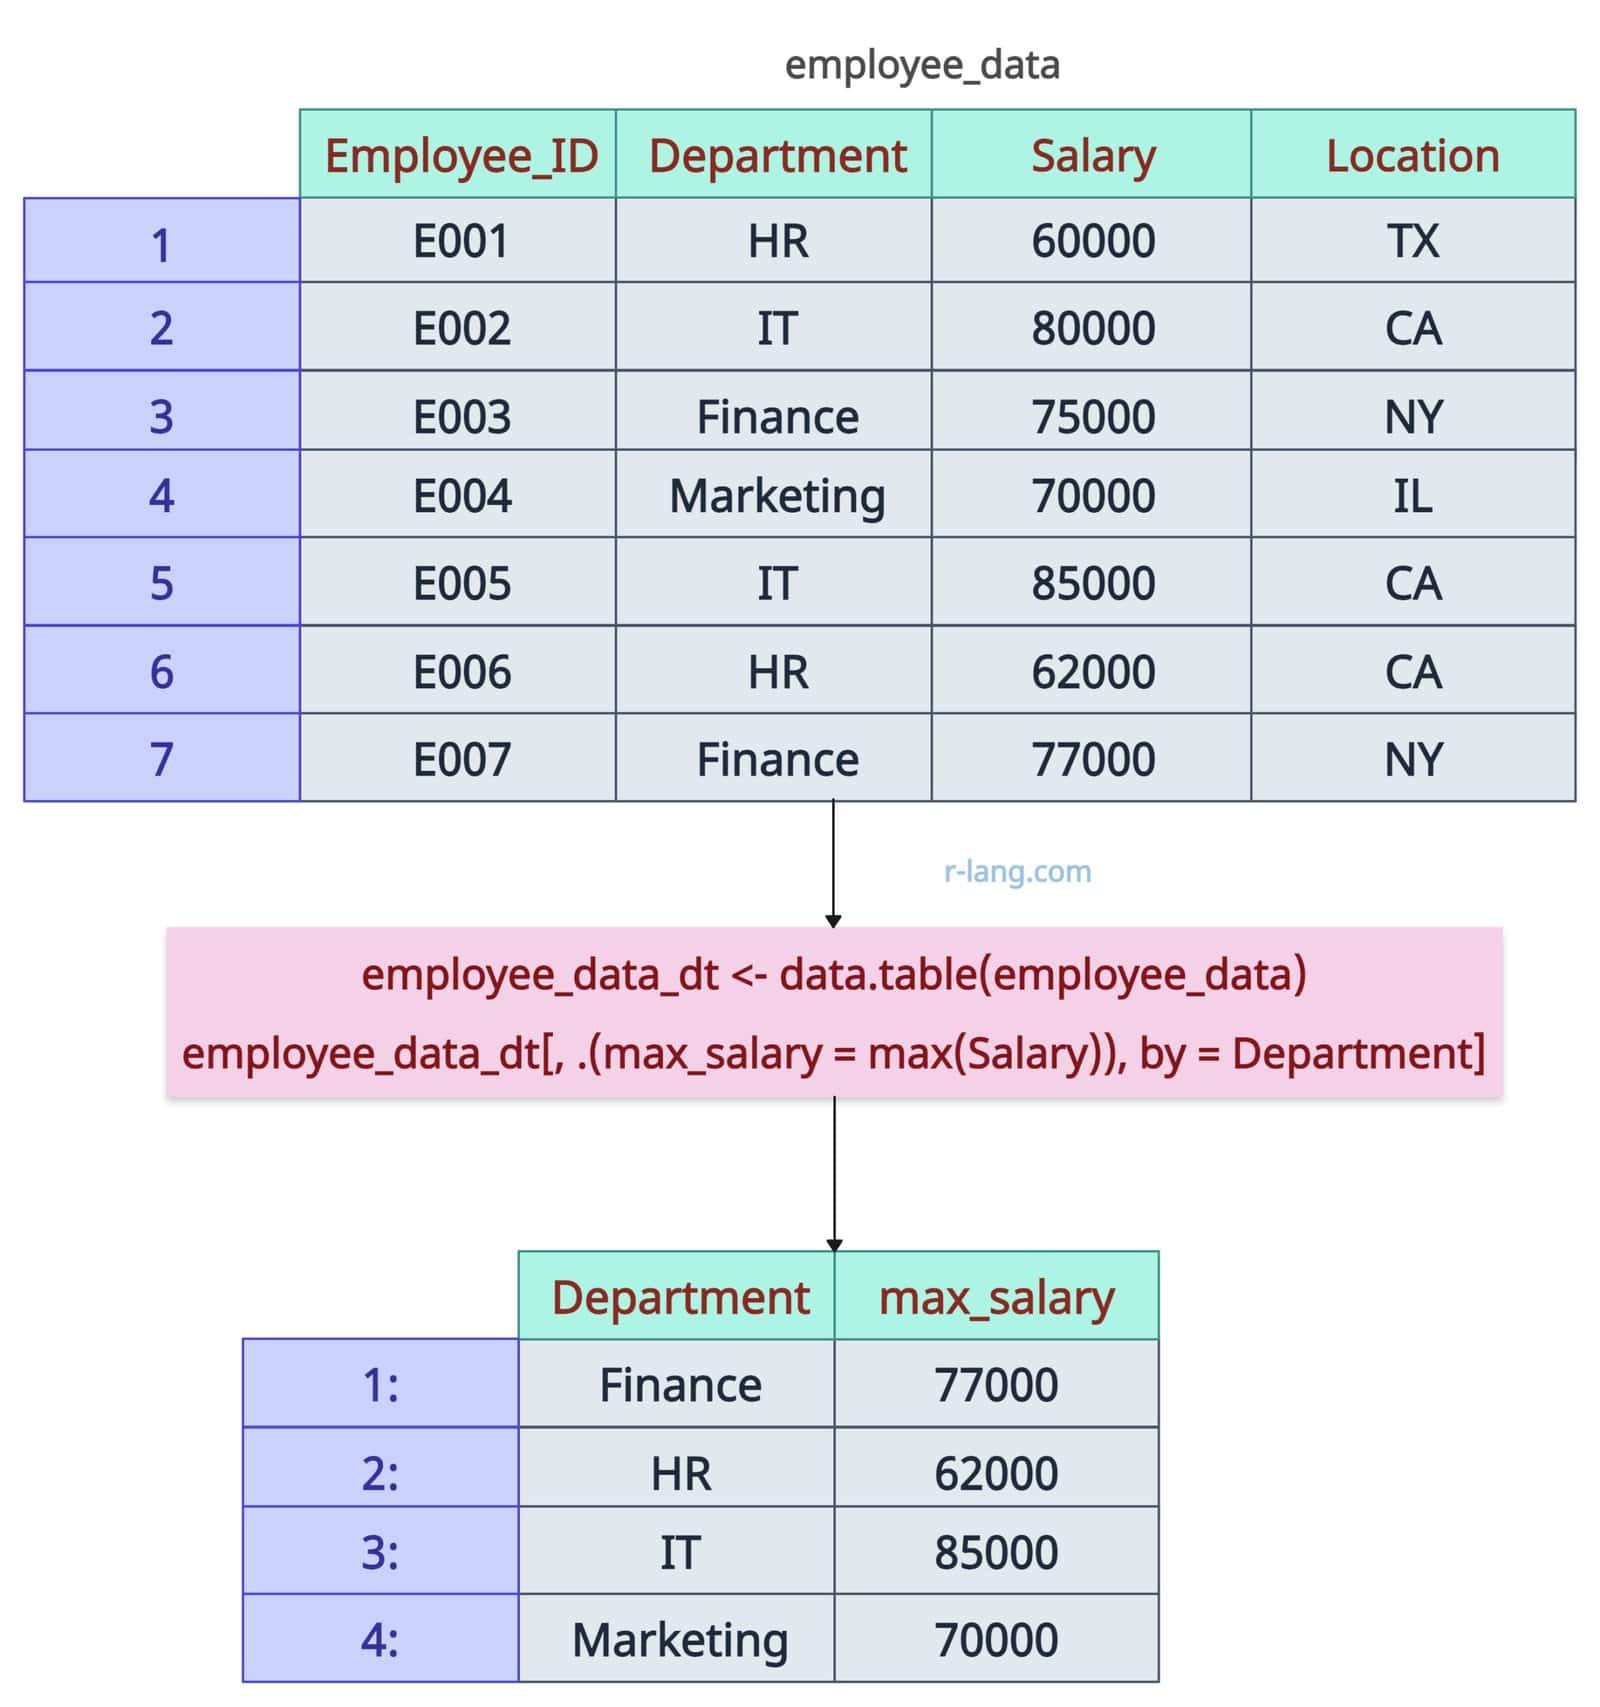
In this code, we used data.table() function to convert the input data frame employee_data to data.table (employee_data_dt).
In the next step, we applied the max() function to the Salary column, grouped by Department, using the “by” argument. The above output is a data table, not a data frame. We get each Department’s highest Salary.
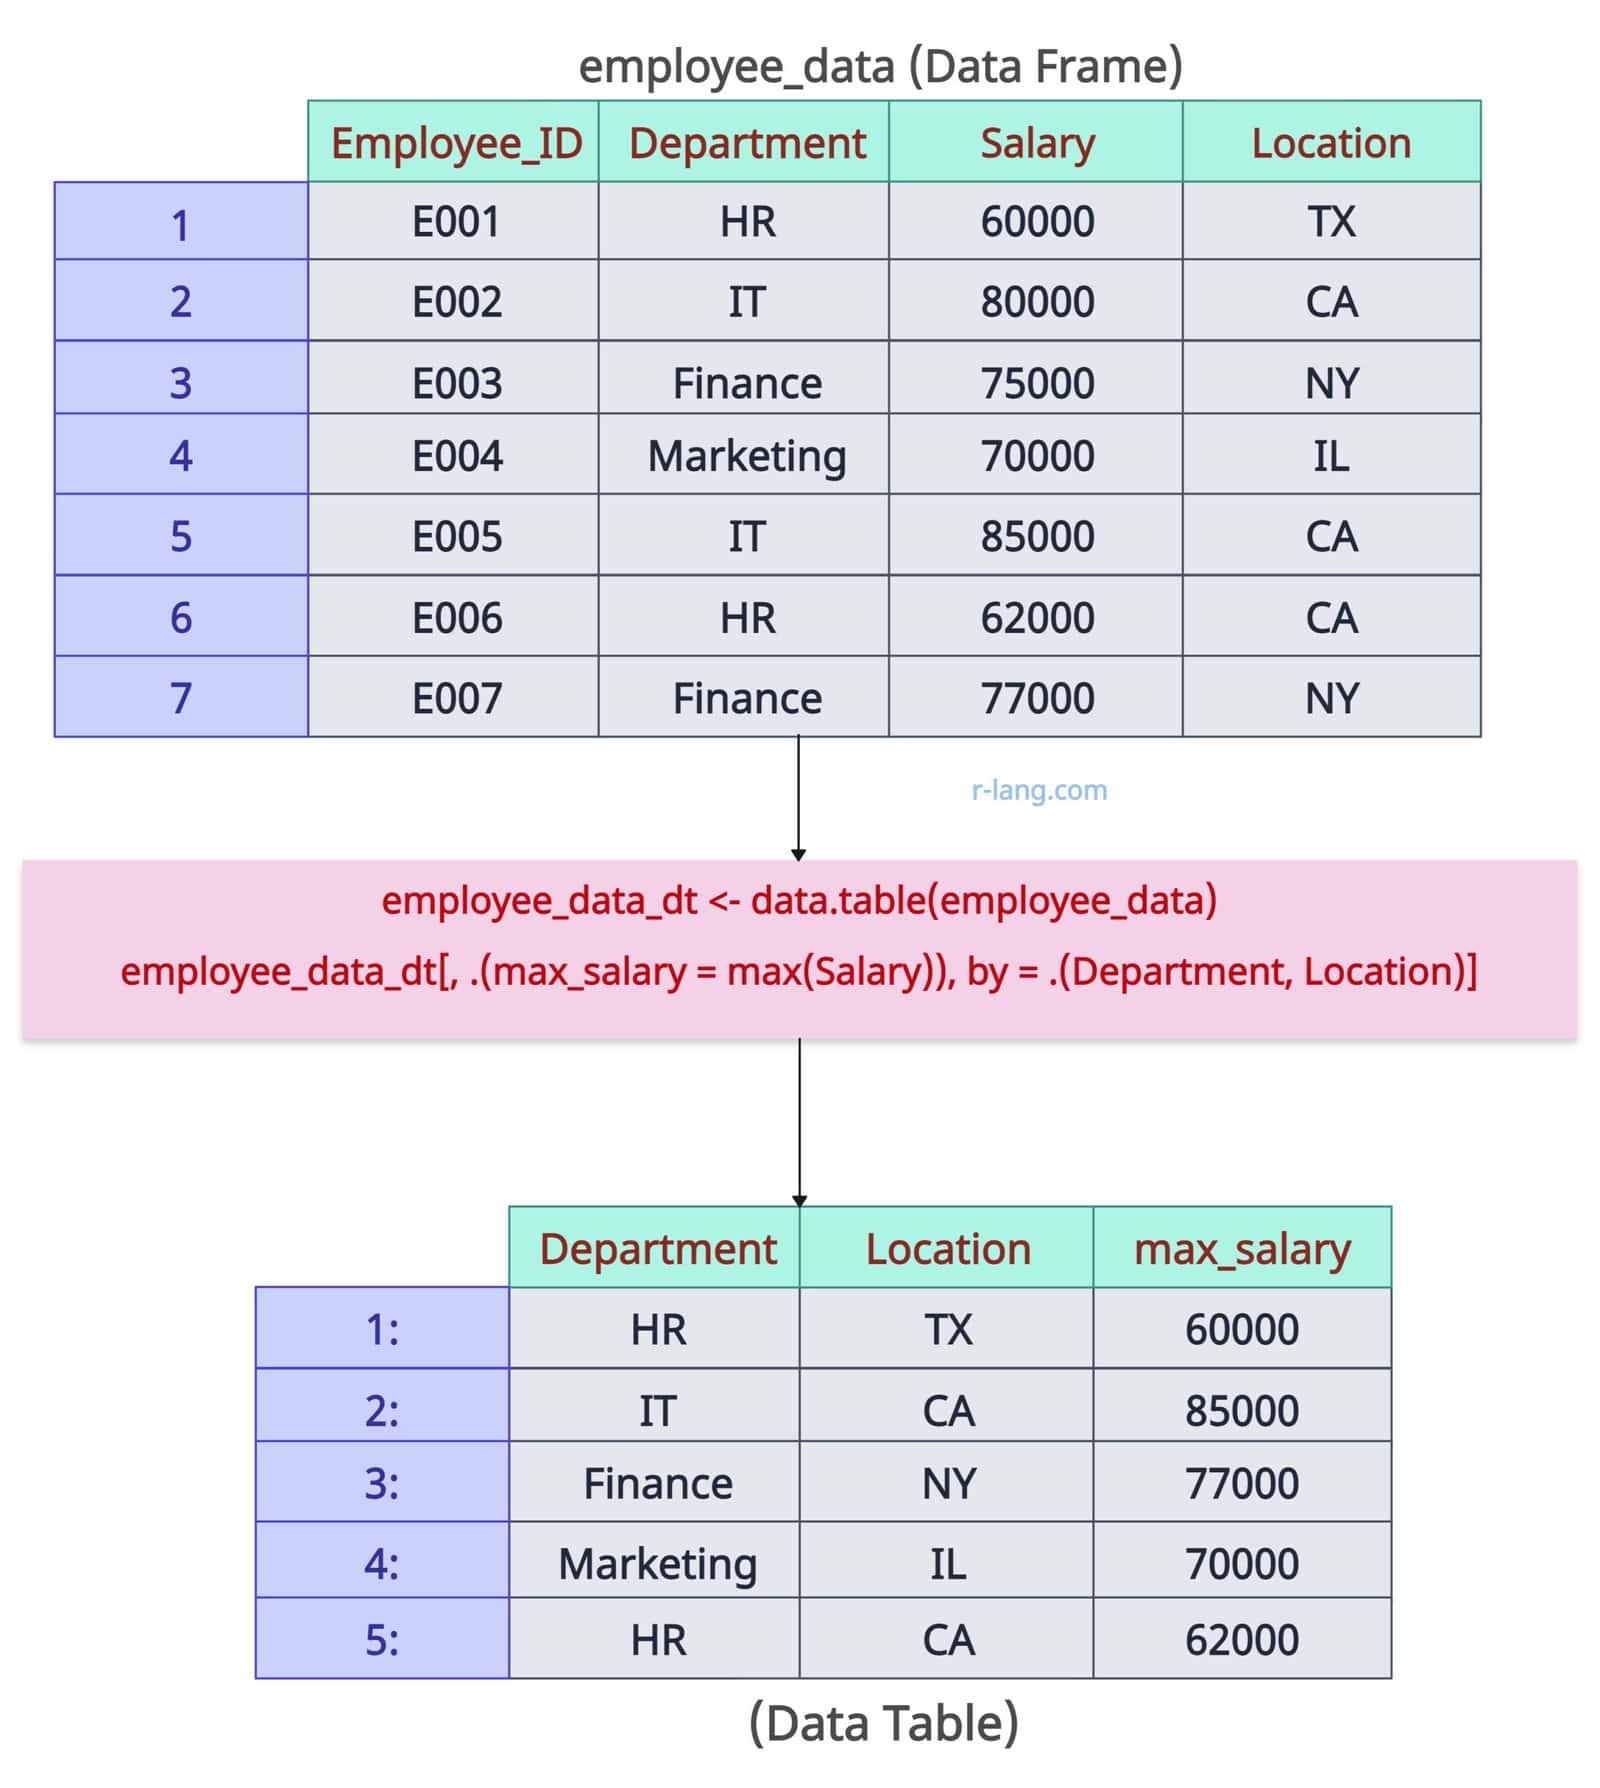
Finding the maximum Salary by Department and Group
library(data.table)

employee_data <- data.frame(
  Employee_ID = c("E001", "E002", "E003", "E004", "E005", "E006", "E007"),
  Department = c("HR", "IT", "Finance", "Marketing", "IT", "HR", "Finance"),
  Salary = c(60000, 80000, 75000, 70000, 85000, 62000, 77000),
  Location = c("TX", "CA", "NY", "IL", "CA", "CA", "NY")
)

print(employee_data)

employee_data_dt <- data.table(employee_data)

# Maximum value by multiple groups
employee_data_dt[, .(max_salary = max(Salary)), by = .(Department, Location)]
Output
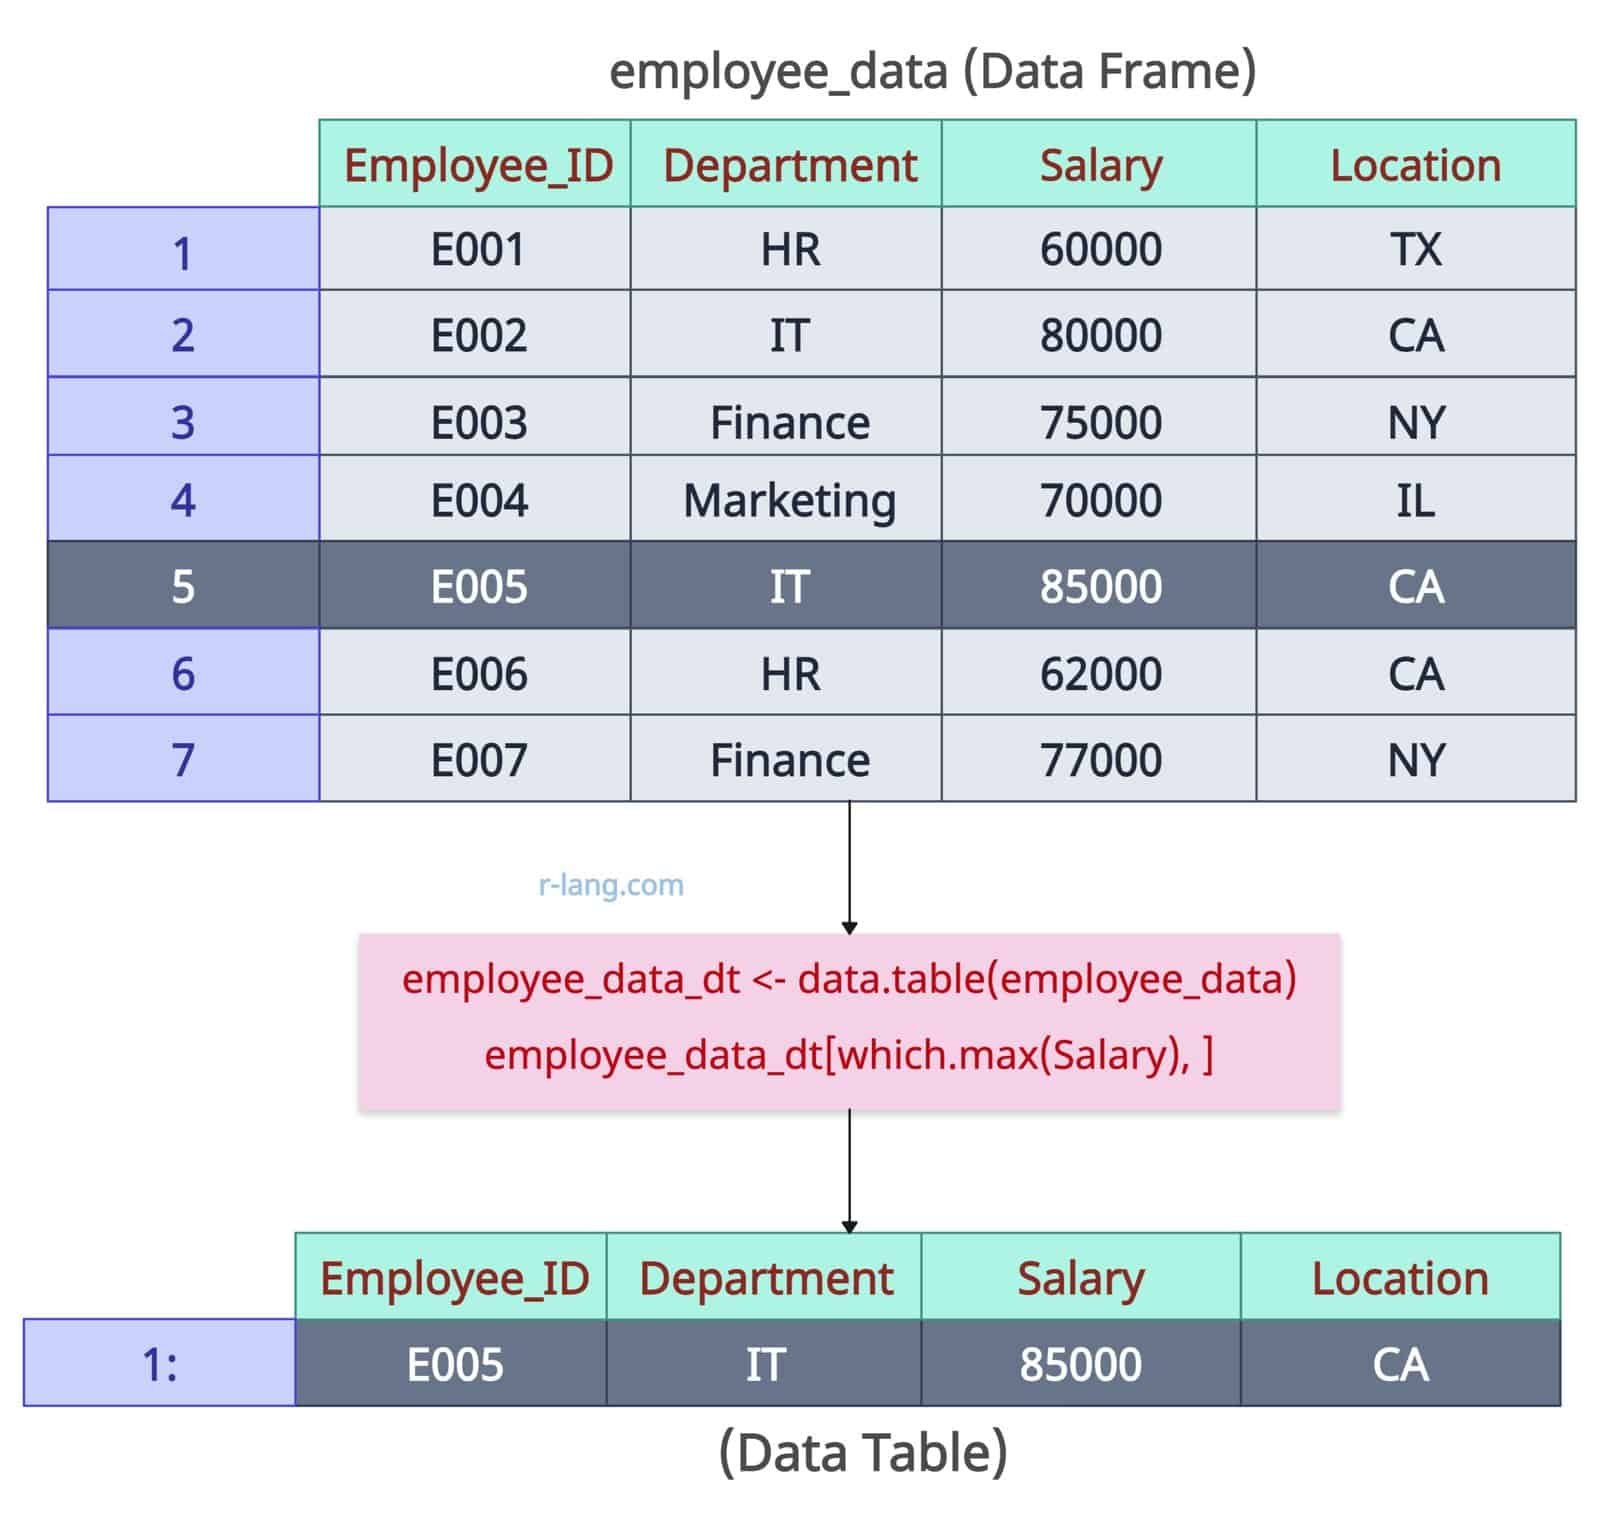
 Finding the maximum value across all columns
library(data.table)

employee_data <- data.frame(
  Employee_ID = c("E001", "E002", "E003", "E004", "E005", "E006", "E007"),
  Department = c("HR", "IT", "Finance", "Marketing", "IT", "HR", "Finance"),
  Salary = c(60000, 80000, 75000, 70000, 85000, 62000, 77000),
  Location = c("TX", "CA", "NY", "IL", "CA", "CA", "NY")
)

print(employee_data)

employee_data_dt <- data.table(employee_data)

# Maximum value across all columns
employee_data_dt[which.max(Salary), ]
Output
That’s all!

Krunal Lathiya is a seasoned Computer Science expert with over eight years in the tech industry. He boasts deep knowledge in Data Science and Machine Learning. Versed in Python, JavaScript, PHP, R, and Golang. Skilled in frameworks like Angular and React and platforms such as Node.js. His expertise spans both front-end and back-end development. His proficiency in the Python language stands as a testament to his versatility and commitment to the craft.