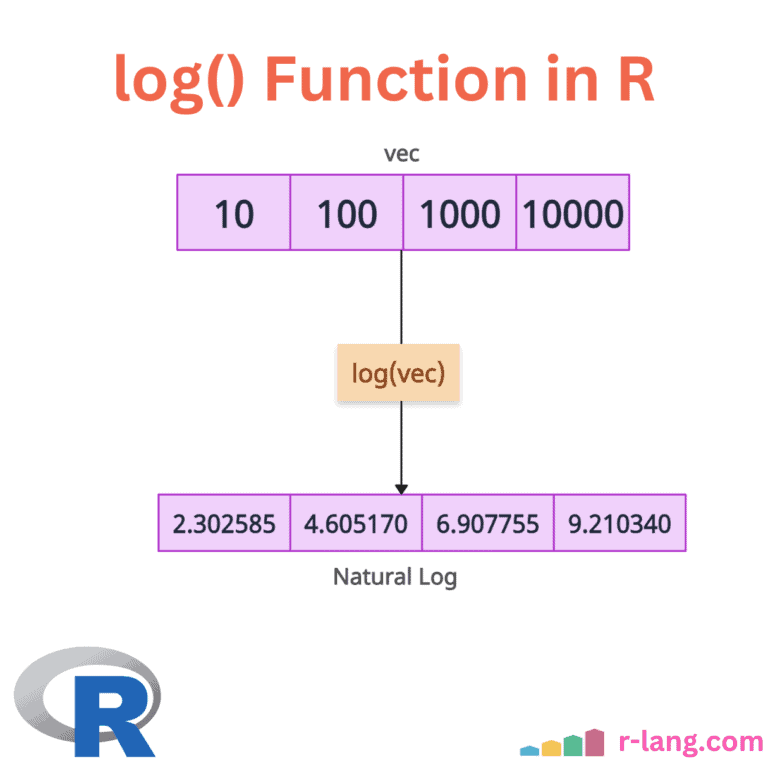
The log() function calculates the natural logarithm (base e) of a numeric vector. By default, it calculates natural log, but can also calculate to any base.
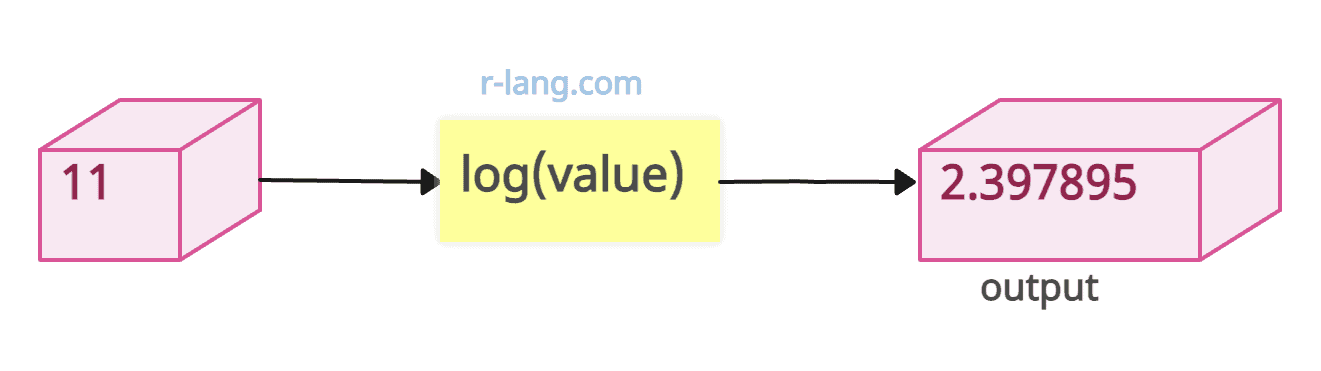
The above figure shows that the output is the log of an input value 11. This method is mostly used in data scaling, mathematical transformation, and statistical modeling.
Syntax
log(num, base)Parameters
| Argument | Description |
| num | It represents a numeric vector or an object whose log you need to calculate. It should be positive. |
| base | It represents the base of the logarithm. Defaults to exp(1) (Euler’s number, ≈ 2.718), giving the natural logarithm. |
Calculating the log base e
Let’s just calculate the natural log without passing any argument. The input value must be a positive scalar.
log(11)

# Output: [1] 2.397895
Standard bases (10 and 2)
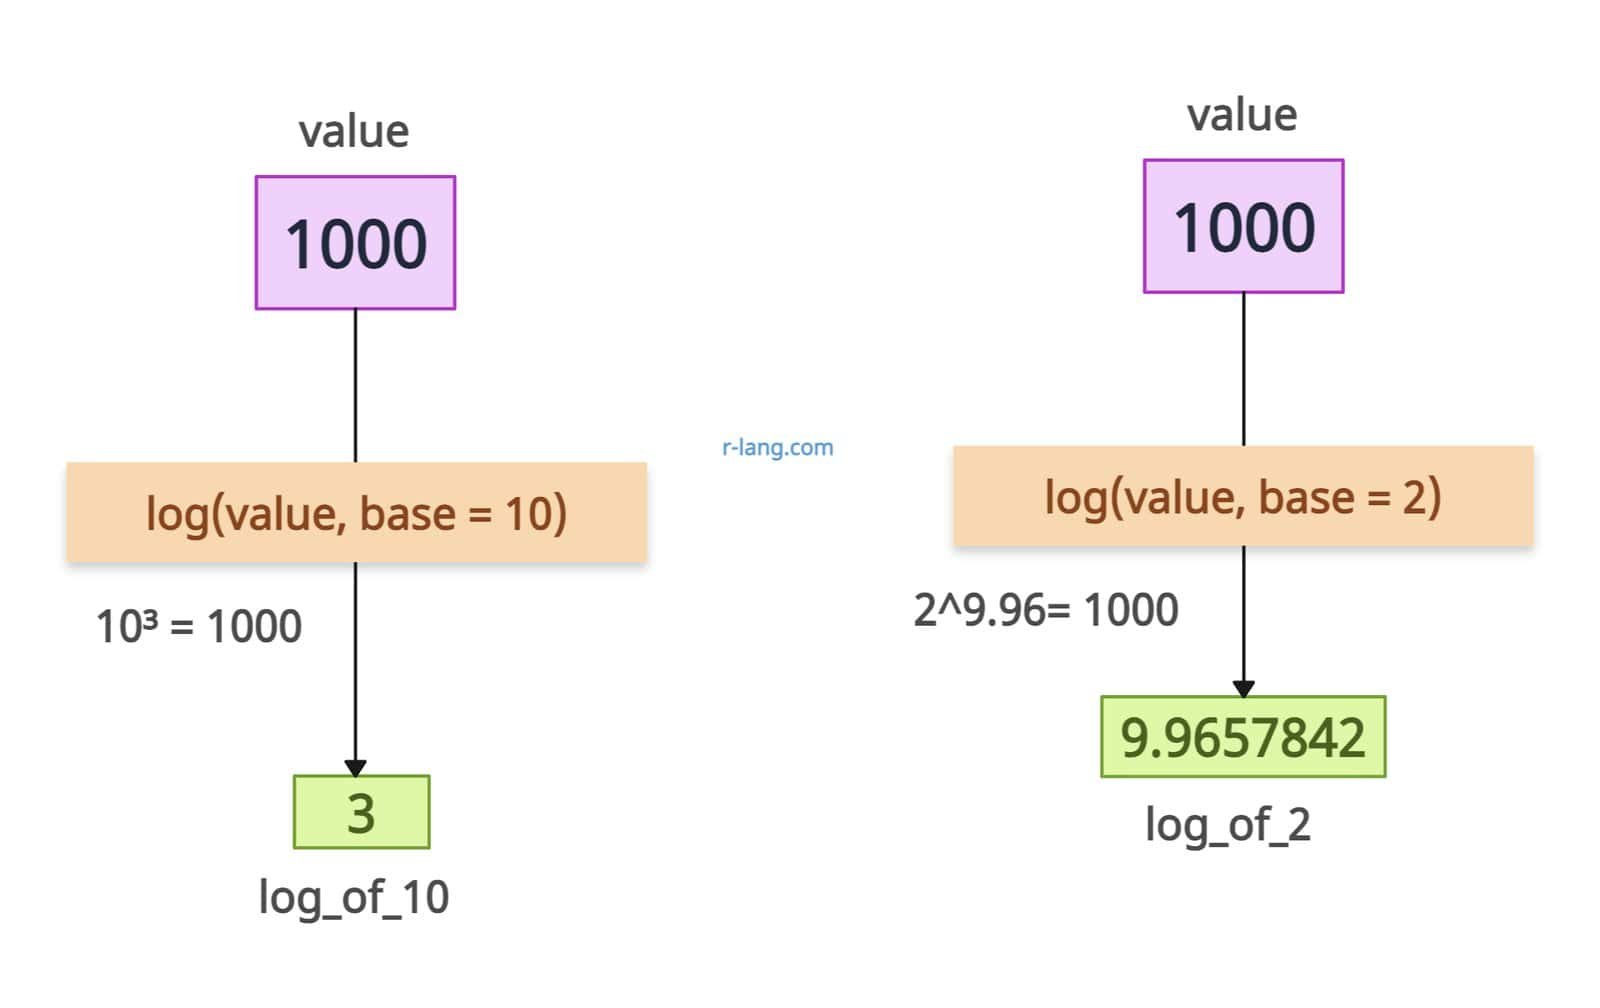
Let’s calculate the log10() and log2() of numeric inputs using the log() function by passing the base 2 and 10.
value <- 1000
base_10 <- 10
base_2 <- 2

log_of_10 = log(value, base = base_10)
log_of_2 = log(value, base = base_2)

cat("Logarithm of", value, "to base", base_10, "is:", log_of_10, "\n")
cat("Logarithm of", value, "to base", base_2, "is:", log_of_2, "\n")

# Output:
# Logarithm of 1000 to base 10 is: 3
# Logarithm of 1000 to base 2 is: 9.9657842
Arbitrary base
We can pass any arbitrary base, apart from the most common bases, and it will work great. Let’s pass 3 as a base and see the output.
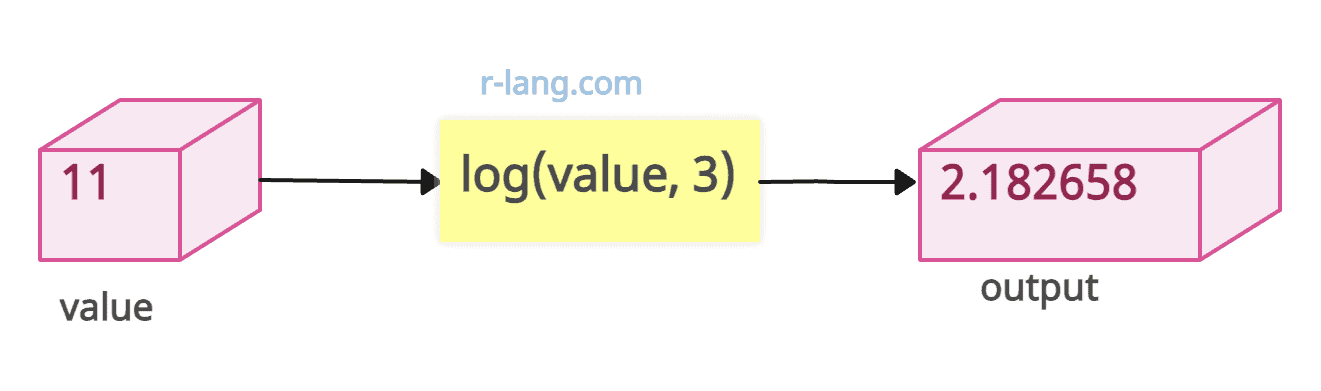
value <- 11

output <- log(value, 3)

cat("Calculating the log of 11 with base 3: ")

cat(output, "\n")

# Output: Calculating the log of 11 with base 3: 2.182658
Vector
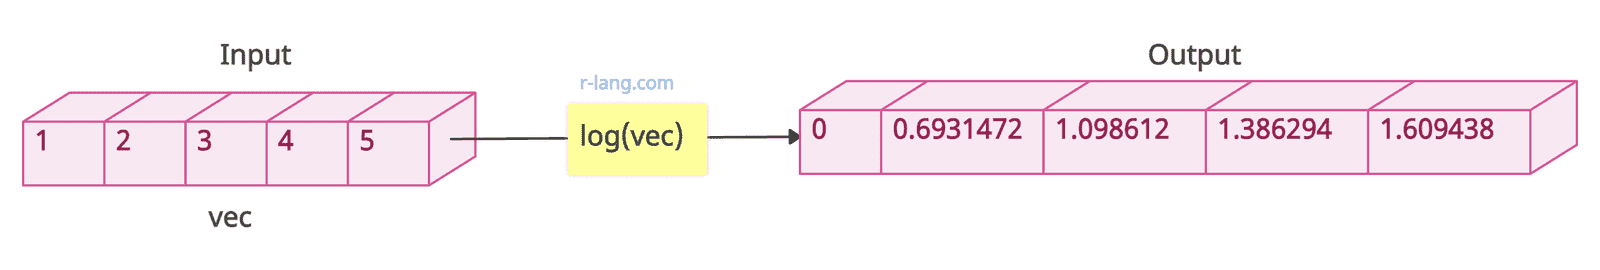
The log() function is a vectorized operation, meaning it will apply to each element of the vector. It operates element-wise on matrices or arrays as well.
So, if your input vector contains five elements, the output will be a vector, and it should contain five elements as well.
vec <- rep(1:5)
cat("The vector sequence is: ")
cat(vec, "\n")
cat("The log() of vector sequence is: ")
cat(log(vec), "\n")
# Output:
# The vector sequence is: 1 2 3 4 5
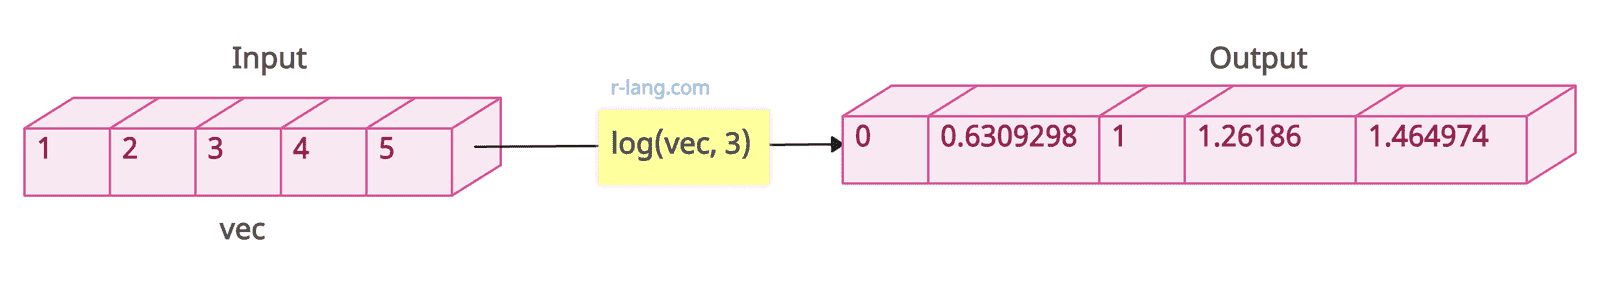
# The log() of vector sequence is: 0 0.6931472 1.098612 1.386294 1.609438Let’s find the log of the vector sequence to base 3.
vec <- rep(1:5)

cat("The vector sequence is: ")
cat(vec, "\n")

cat("Calculating the log(vec, 3) of vector sequence: ")
cat(log(vec, 3), "\n")

# Output:
# The vector sequence is: 1 2 3 4 5
# Calculating the log(vec, 3) of vector sequence: 0  0.6309298  1  1.26186  1.464974
0 and a negative value
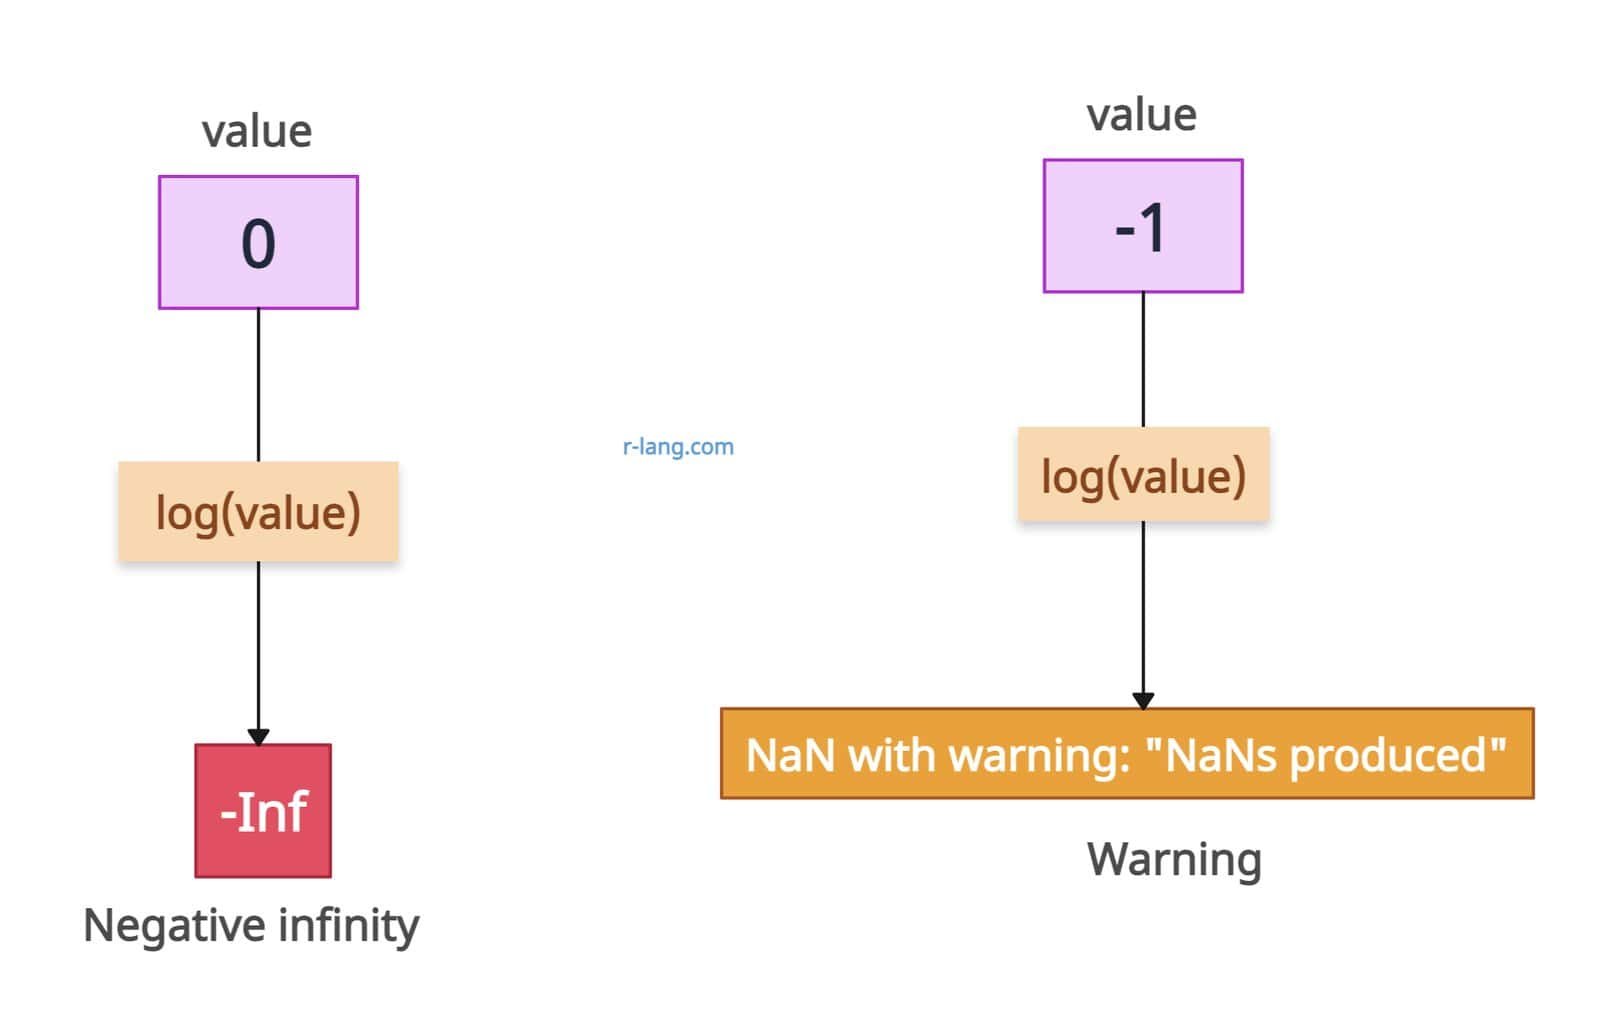
If you pass 0, it returns -Inf , which means the negative infinity.
If you pass a negative number, it returns NaN.
log(0)
# Output: -Inf

log(-1)
# Output: NaN with warning: "NaNs produced"
Complex vector
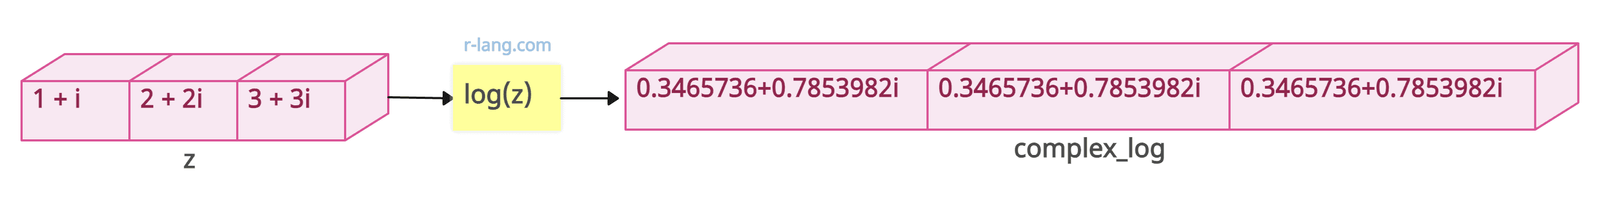
If your input is a complex vector, it won’t throw an error. Instead, it calculates normally and returns the proper output.
# Define a complex vector
z <- c(1 + 1i, 2 + 2i, 3 + 3i)

# Calculate the natural log
complex_log <- log(z)

# Display the result
print(complex_log)

# Output: [1] 0.3465736+0.7853982i   1.0397208+0.7853982i   1.4451859+0.7853982i
Inverse relationship with exp()
The exp() method reverses the log() function for natural logarithms. Here is the code example:
data <- 21

log_exp <- exp(log(data))

log_exp

# Output: [1] 21
Column in a data frame
When working with a data frame, we need to apply the log() function to a specific column. For selecting a column, you can use the dollar sign($) selector and apply the log to it, and append it to a data frame.
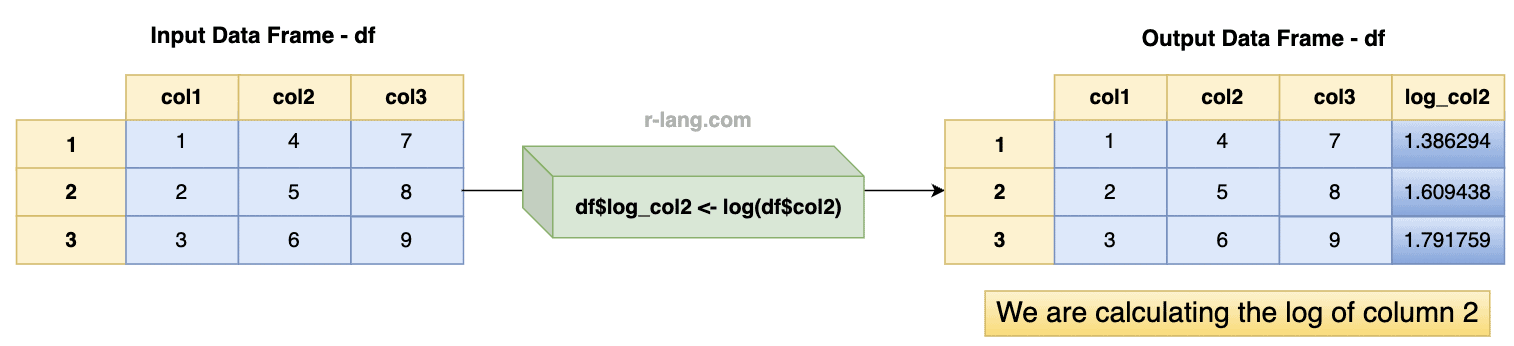
df <- data.frame(
  col1 = c(1, 2, 3),
  col2 = c(4, 5, 6),
  col3 = c(7, 8, 9)
)
cat("Before calculating the df column", "\n")
df

cat("After calculating the df column", "\n")
df$log_col2 <- log(df$col2)
df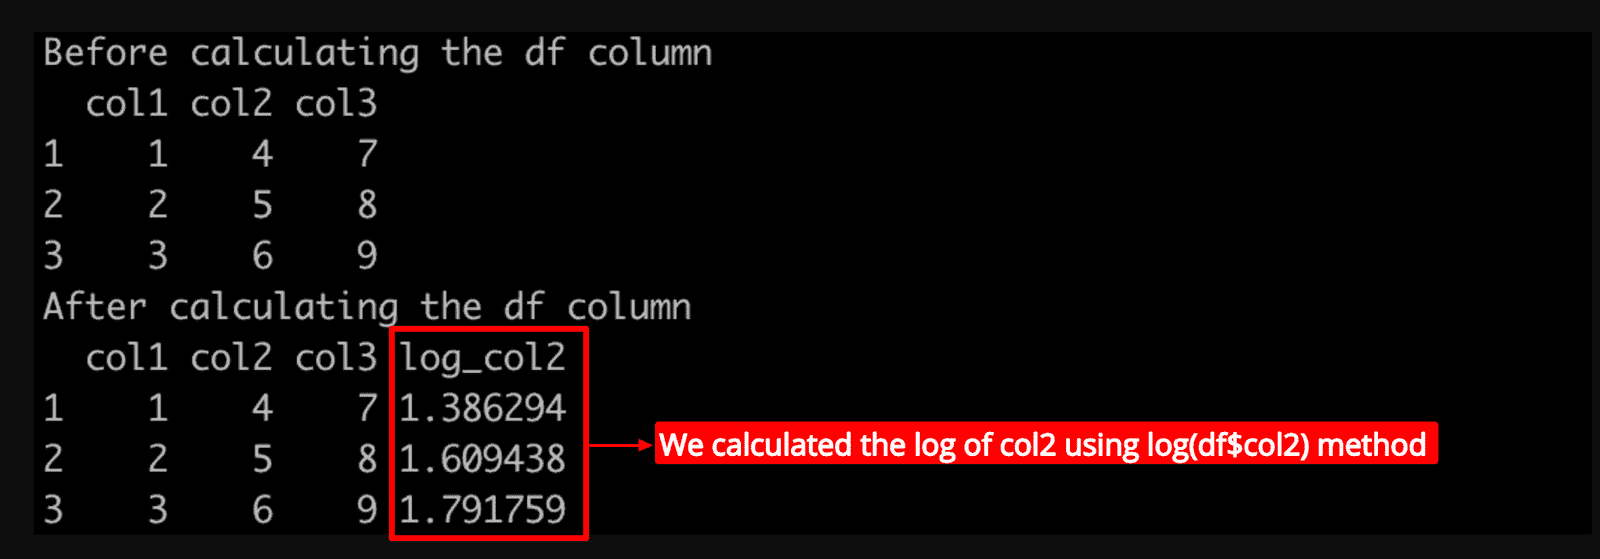
Plotting
For creating a plot of the log() function, we can use the built-in plot() function and pass the various data points.
To create various data points, you can use the seq() method.
data <- seq(0, 100, by = 0.1)

plot(data, log(data), typ = "l", col = "red")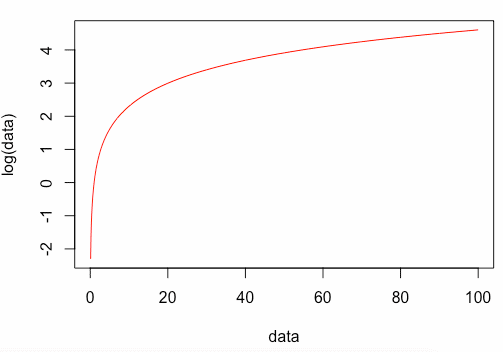
That’s it!

Krunal Lathiya is a seasoned Computer Science expert with over eight years in the tech industry. He boasts deep knowledge in Data Science and Machine Learning. Versed in Python, JavaScript, PHP, R, and Golang. Skilled in frameworks like Angular and React and platforms such as Node.js. His expertise spans both front-end and back-end development. His proficiency in the Python language stands as a testament to his versatility and commitment to the craft.