Here are the two most prominent ways to select rows by single or multiple conditions in R:
Subsetting with square brackets ([ ]) is a basic method for selecting rows where a column meets a specific condition. For example, df[df$column_name > value, ].
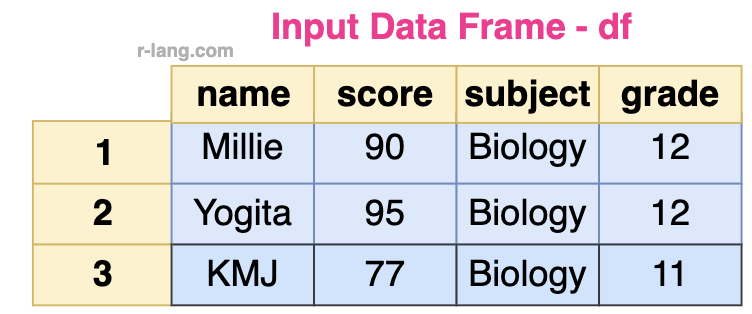
Here is the input data frame:
df <- data.frame(
  name = c("Millie", "Yogita", "KMJ"),
  score = c(90, 95, 77),
  subject = c("Biology", "Biology", "Biology"),
  grade = c(12, 12, 11)
)Let’s apply a single condition to filter rows using subsetting.
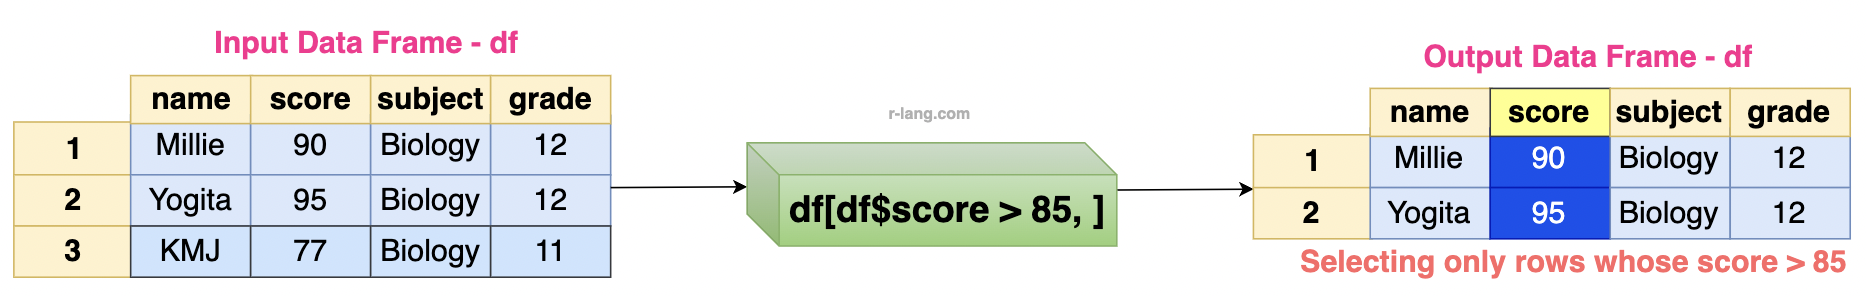
Fetch me the rows where ‘score’ > 85.
df <- data.frame(
  name = c("Millie", "Yogita", "KMJ"),
  score = c(90, 95, 77),
  subject = c("Biology", "Biology", "Biology"),
  grade = c(12, 12, 11)
)

df[df$score > 85, ]
Our central column to filter is “score”, and you can select any column of the data frame using the “df$score” syntax, which we have done.
For filtering, we used a greater than (>) sign to select only columns with scores greater than 85.
To apply multiple conditions at once, you can use the And (&)/Or (|) operator. But make sure to use the vector logical operators & and |, not the scalar ones && or ||.
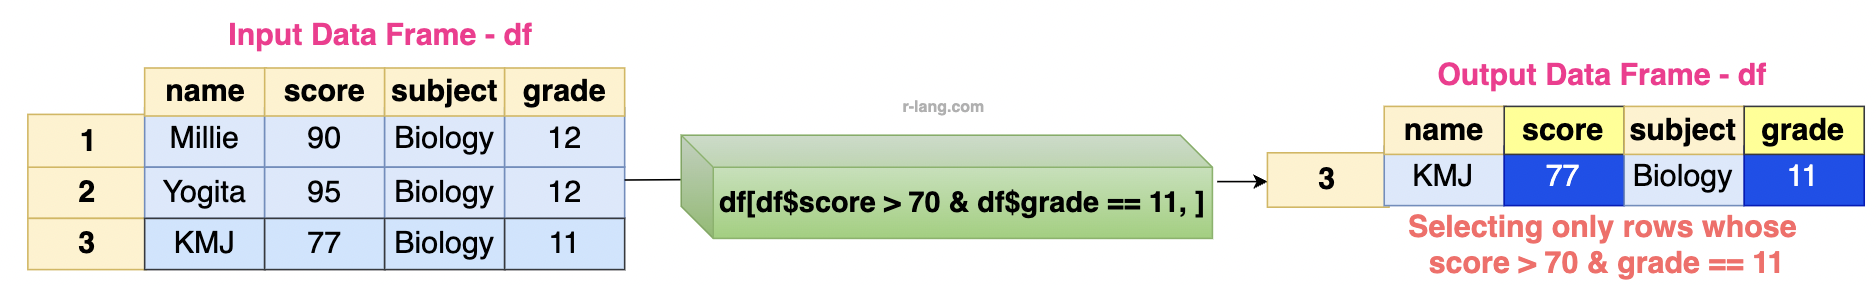
Let’s select only rows whose score is > 70 & grade == 11.
df <- data.frame(
  name = c("Millie", "Yogita", "KMJ"),
  score = c(90, 95, 77),
  subject = c("Biology", "Biology", "Biology"),
  grade = c(12, 12, 11)
)

df[df$score > 70 & df$grade == 11, ]
After filtering, only row number 3 satisfied our conditions, so it was included in the output, as shown in the figure above.
If there are NAs in the column, the condition might result in NA, which would be treated as FALSE in subsetting.
Using a function like is.na(), we can check for any NA values before subsetting on it.
Although our data frame does not contain any NA values, we can use a different data frame that contains NA values.
df <- data.frame(
  name = c("Millie", "Yogita", NA),
  score = c(90, 95, NA),
  subject = c("Biology", "Biology", "Biology"),
  grade = c(12, 12, 11)
)

df[is.na(df$score) | df$age > 70, ][1] name score subject grade
<0 rows> (or 0-length row.names)
Since our data frame, df, contains NA values, we get zero rows in the output.
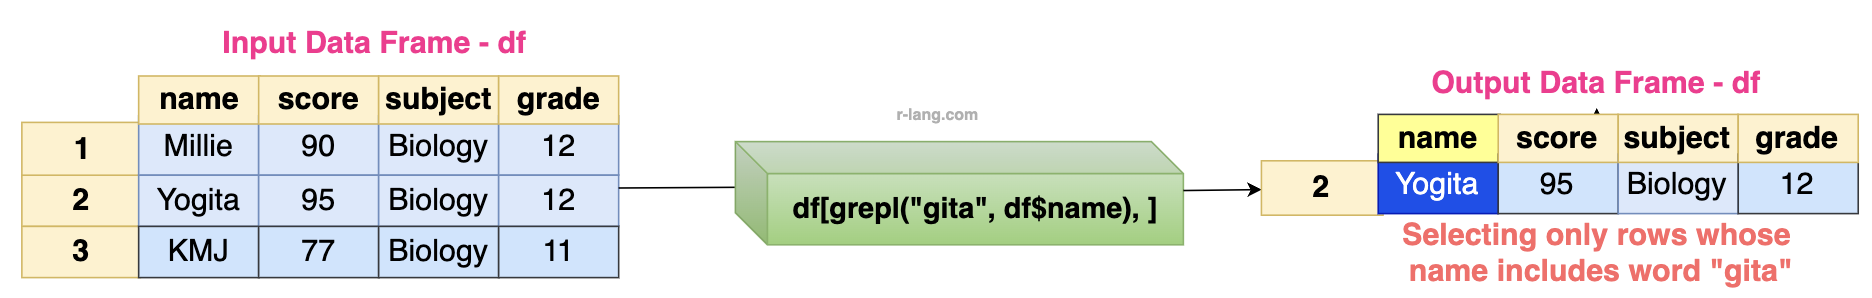
Let’s select rows based on specific string column values using the grepl() function.
df <- data.frame(
  name = c("Millie", "Yogita", "KMJ"),
  score = c(90, 95, 77),
  subject = c("Biology", "Biology", "Biology"),
  grade = c(12, 12, 11)
)

df[grepl("gita", df$name), ]The dplyr filter() function subsets a data frame, retaining all rows that satisfy your conditions. For example df %>% filter(column_name > value).
The dplyr is a third-party package, so we need to install and load it in our program:
install.packages("dplyr")

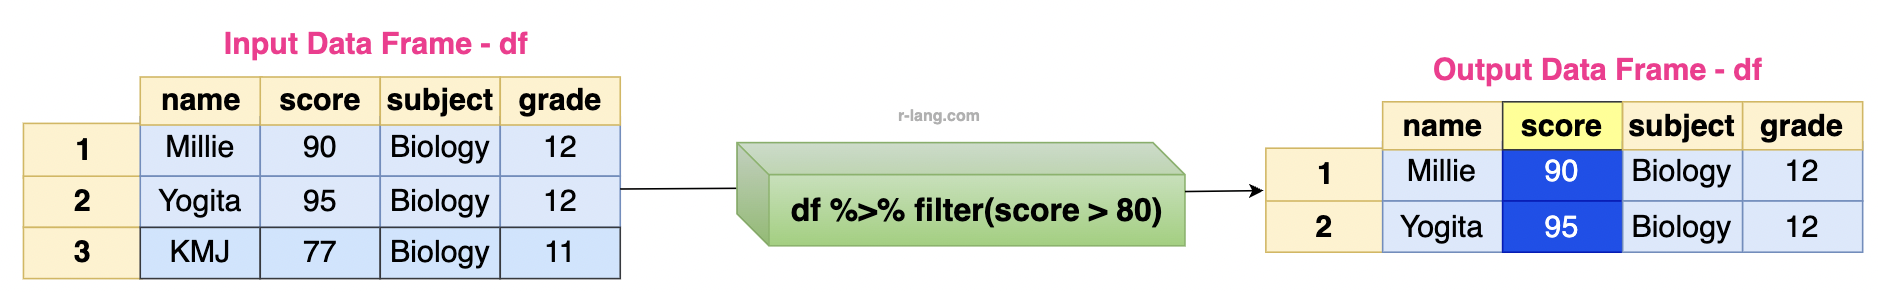
library(dplyr)Let’s select rows whose score is > 80 using the df %>% filter() function.
library(dplyr)

df <- data.frame(
  name = c("Millie", "Yogita", "KMJ"),
  score = c(90, 95, 77),
  subject = c("Biology", "Biology", "Biology"),
  grade = c(12, 12, 11)
)
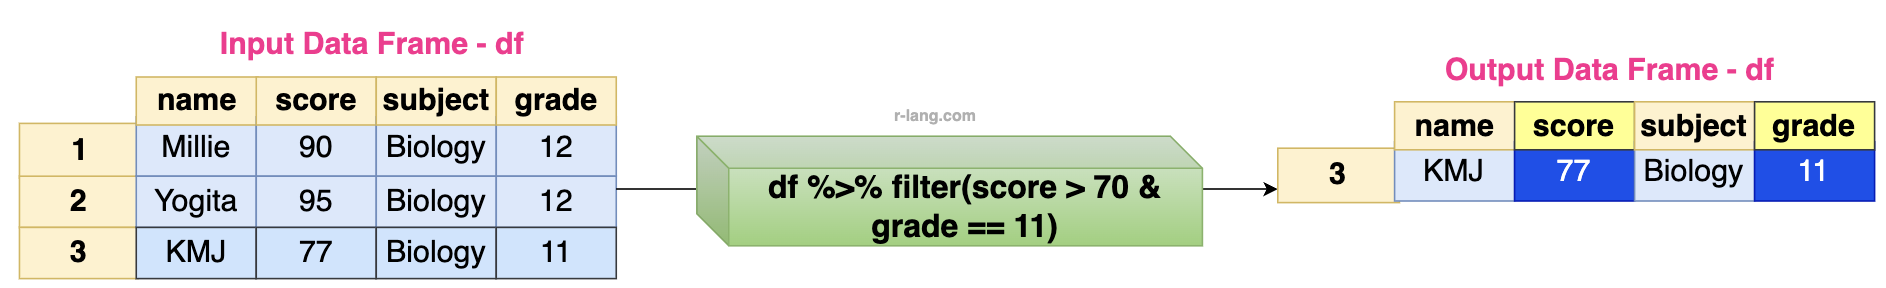
df %>% filter(score > 80)For multiple conditions, we can use: df %>% filter(first_column > value1, second_column == “value2”) or use “&” between conditions.
library(dplyr)

df <- data.frame(
  name = c("Millie", "Yogita", "KMJ"),
  score = c(90, 95, 77),
 subject = c("Biology", "Biology", "Biology"),
  grade = c(12, 12, 11)
)

df %>% filter(score > 70 & grade == 11)
Both methods provide flexibility; you can choose whichever method suits your workflow and readability needs.
Krunal Lathiya is a seasoned Computer Science expert with over eight years in the tech industry. He boasts deep knowledge in Data Science and Machine Learning. Versed in Python, JavaScript, PHP, R, and Golang. Skilled in frameworks like Angular and React and platforms such as Node.js. His expertise spans both front-end and back-end development. His proficiency in the Python language stands as a testament to his versatility and commitment to the craft.
The scale() function in R centers (subtracting the mean) and/or scales (dividing by the standard…
To rename a file in R, you can use the file.rename() function. It renames a…
The prop.table() function in R calculates the proportion or relative frequency of values in a…
The exp() is a built-in function that calculates the exponential of its input, raising Euler's…
The split() function divides the input data into groups based on some criteria, typically specified…
The colMeans() function in R calculates the arithmetic mean of columns in a numeric matrix,…