The best and most efficient way to remove rows from a data frame is using “negative indexing”. It is a base R approach that does not require any packages.
However, there are different approaches you should be aware of, depending on the situation you are encountering.
Here are five ways:
Negative sign (-) means exclusion. If you have a data frame df and you want to remove the first row, you just need to write df[-1, ].
For multiple rows, use df[-c(1,3,5), ], which will remove rows 1, 3, and 5. It is a removal by row number. The c() function combines the indices, and the negative sign excludes them.
It is the process of accessing a data frame without specifying some rows using a negative index. This is also called row indexing.
df[-c(row_index_1, row_index_2),]df <- data.frame(
Shares = c("TCS", "Reliance", "HDFC Bank", "HUL", "KPIT"),
Price = c(3200, 1900, 1500, 2200, 1400)
)
df_remain <- df[-c(3), ]
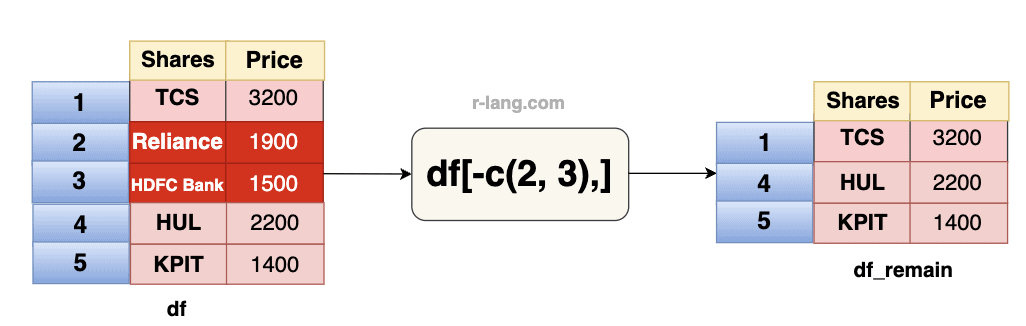
df_remainTo remove the second and third rows, use -c(2, 3). The negative sign before c(2, 3) tells R to exclude those rows.
df <- data.frame(
   Shares = c("TCS", "Reliance", "HDFC Bank", "HUL", KPIT),
   Price = c(3200, 1900, 1500, 2200, 1400)
)

df_remain <- df[-c(2, 3),]
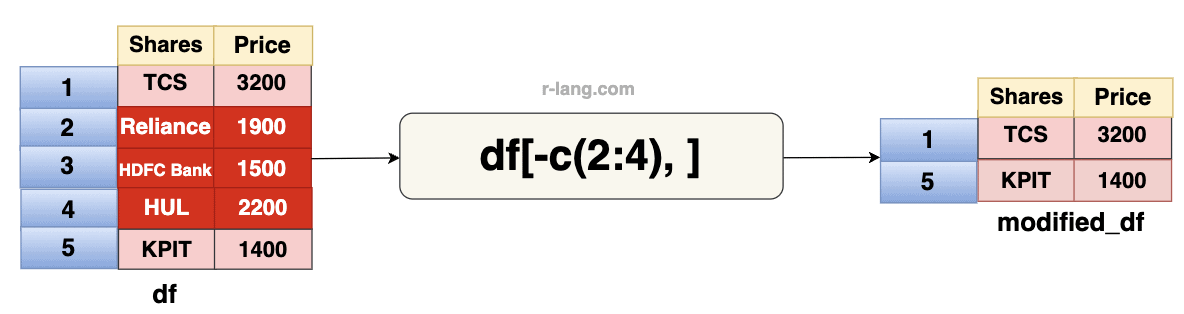
df_remainIf you want to remove multiple rows, you can define them as a range. For example, -c(2:4) refers to the sequence of rows (rows 2, 3, and 4) that will be excluded from the data frame.
df <- data.frame(
  Shares = c("TCS", "Reliance", "HDFC Bank", "HUL", "KPIT"),
  Price = c(3200, 1900, 1500, 2200, 1400)
)

modified_df <- df[-c(2:4), ]

modified_df
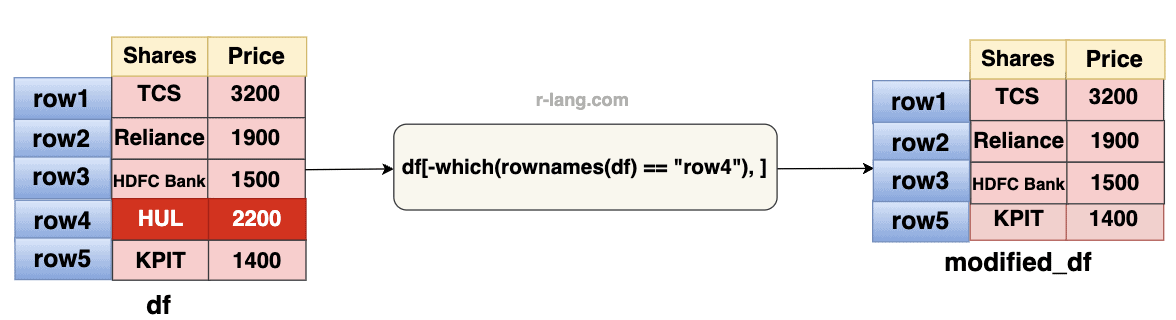
If you have a data frame that contains row names, you can remove the row by its name using the which() function. To get the specific row name, use the rownames() function.
df <- data.frame(
  Shares = c("TCS", "Reliance", "HDFC Bank", "HUL", "KPIT"),
  Price = c(3200, 1900, 1500, 2200, 1400)
)

rownames(df) <- c("row1", "row2", "row3", "row4", "row5")

cat("After removing 4th row", "\n")

modified_df <- df[-which(rownames(df) == "row4"), ]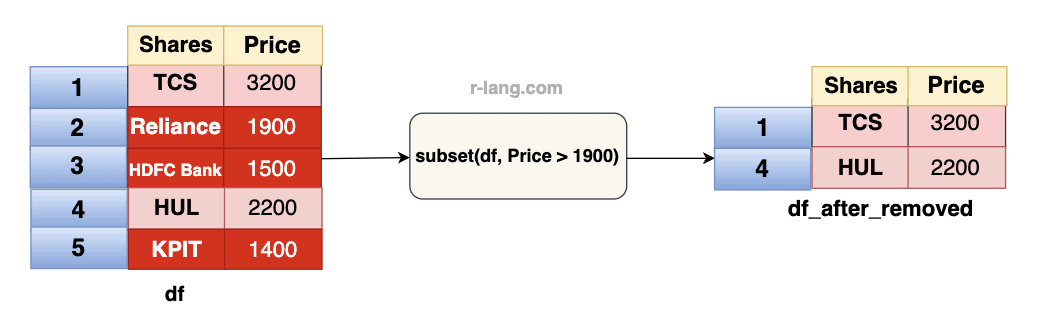
modified_dfThe subset() function is helpful when you have a specific logical condition. It removes only the rows that meet that condition.
To properly use the subset() function, you must provide a logical expression that evaluates FALSE for the rows you want to remove.
df <- data.frame(
  Shares = c("TCS", "Reliance", "HDFC Bank", "HUL", "KPIT"),
  Price = c(3200, 1900, 1500, 2200, 1400)
)

df_after_removed <- subset(df, Price > 1900)

df_after_removed
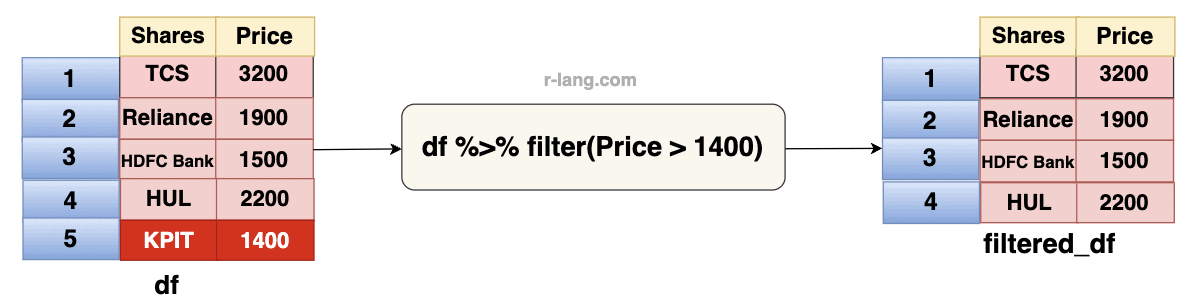
If you already use the dplyr package in your program, then you can use the dplyr package’s filter() or slice() function.
You can pass the condition using a logical expression to the filter() function, which will filter out the rows for you.
library(dplyr)

df <- data.frame(
  Shares = c("TCS", "Reliance", "HDFC Bank", "HUL", "KPIT"),
  Price = c(3200, 1900, 1500, 2200, 1400)
)

filtered_df <- df %>% filter(Price > 1400)

filtered_dfPass the indices you want to remove in the slice() function, and it will remove it from the data frame.
library(dplyr)

df <- data.frame(
  Shares = c("TCS", "Reliance", "HDFC Bank", "HUL", "KPIT"),
  Price = c(3200, 1900, 1500, 2200, 1400)
)

# Remove rows using slice()
df_sliced <- df %>%
  slice(-c(1, 4, 5)) # Exclude rows 1, 4, ands 5

print(df_sliced)
Output
   Shares     Price
1  Reliance   1900
2  HDFC Bank  1500
Check out removing duplicate rows from the data frame article for more information.
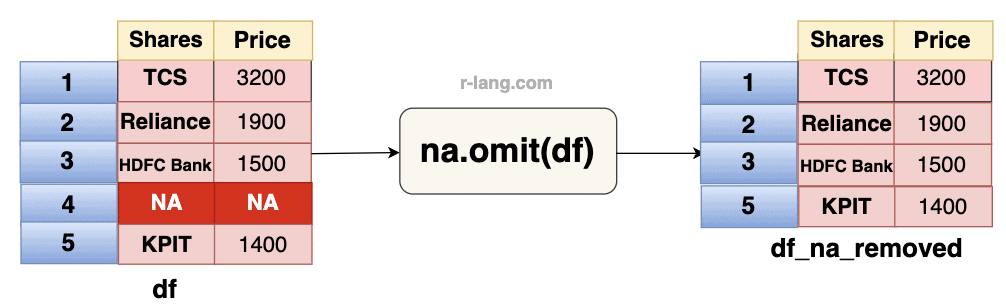
If you want to quickly remove rows with NA values, use the built-in na.omit() function. For more targeted NA removal, I recommend using the complete.cases() or tidyr::drop_na() functions.
df <- data.frame(
  Shares = c("TCS", "Reliance", "HDFC Bank", NA, "KPIT"),
  Price = c(3200, 1900, 1500, NA, 1400)
)

df_na_removed <- na.omit(df)

df_na_removed
That’s it!
Krunal Lathiya is a seasoned Computer Science expert with over eight years in the tech industry. He boasts deep knowledge in Data Science and Machine Learning. Versed in Python, JavaScript, PHP, R, and Golang. Skilled in frameworks like Angular and React and platforms such as Node.js. His expertise spans both front-end and back-end development. His proficiency in the Python language stands as a testament to his versatility and commitment to the craft.
The scale() function in R centers (subtracting the mean) and/or scales (dividing by the standard…
To rename a file in R, you can use the file.rename() function. It renames a…
The prop.table() function in R calculates the proportion or relative frequency of values in a…
The exp() is a built-in function that calculates the exponential of its input, raising Euler's…
The split() function divides the input data into groups based on some criteria, typically specified…
The colMeans() function in R calculates the arithmetic mean of columns in a numeric matrix,…