
In R, you can calculate the sum by group using the base aggregate(), dplyr’s group_by() with summarise(), or the data table package.
What do we mean when we say sum by group? Well, it means dividing the dataset into meaningful groups based on categorical variables and then calculating the summation of the values within each group.
For example, you may need to calculate the total number of quantities sold per category or product. Another example is summing the total revenue, which you can calculate as (Price × Quantity), for each group.
For this practical, we will use the df_sales_data data frame:
df_sales_data <- data.frame(
  Product = c("Apple", "Banana", "Apple", "Milk", "Bread", "Butter", "Milk"),
  Category = c("Fruit", "Fruit", "Fruit", "Dairy", "Bakery", "Dairy", "Dairy"),
  Price = c(1.2, 0.5, 1.2, 2.5, 1.8, 2.0, 2.5),
  Quantity = c(5, 10, 5, 2, 3, 12, 2),
  stringsAsFactors = FALSE
)

print(df_sales_data)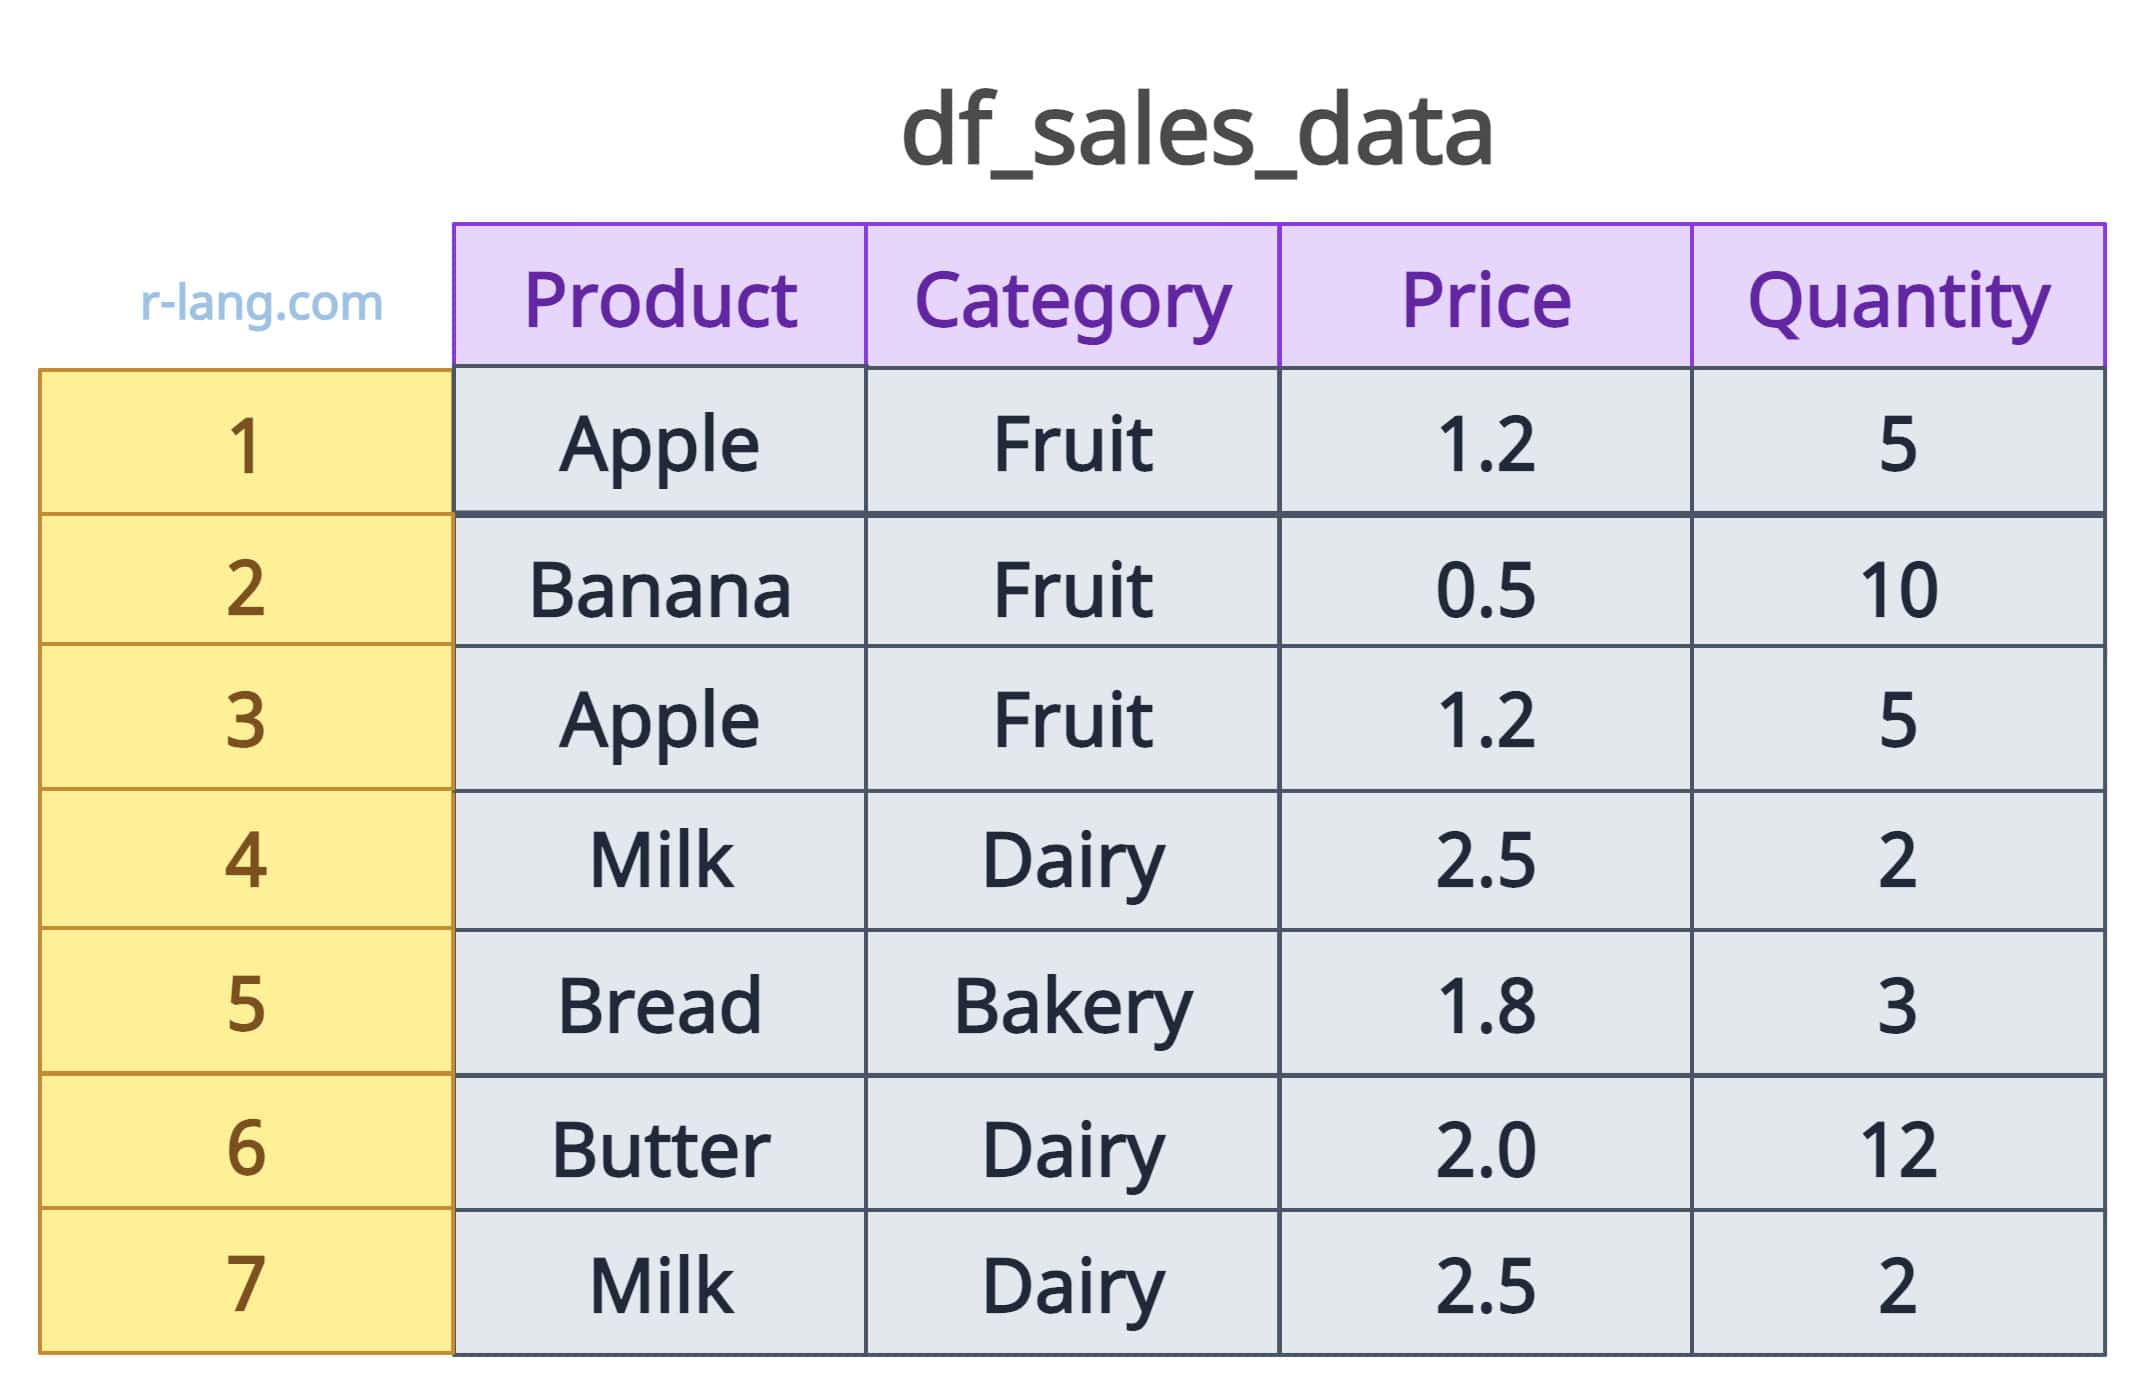
Method 1: Using aggregate()
If you are looking for a built-in solution that does not require packages, you should use the aggregate() function. It accepts a formula for summarization, a dataset, and a function to apply and returns data summarised by groups.
Sum by single group
Let’s calculate the Sum of Quantities by Category:
library(data.table)


df_sales_data <- data.frame(
  Product = c("Apple", "Banana", "Apple", "Milk", "Bread", "Butter", "Milk"),
  Category = c("Fruit", "Fruit", "Fruit", "Dairy", "Bakery", "Dairy", "Dairy"),
  Price = c(1.2, 0.5, 1.2, 2.5, 1.8, 2.0, 2.5),
  Quantity = c(5, 10, 5, 2, 3, 12, 2),
  stringsAsFactors = FALSE
)

print(df_sales_data)

# Calculate sum of quantities by category
aggregate(Quantity ~ Category, data = df_sales_data, FUN = sum)
Output

The above output image shows that we are calculating the total number of quantities based on each category.
- The Bakery category has only one product, which has only 3 quantities.
- The dairy category has 3 products, and the total quantities for the category are 16 (2 + 12 + 2).
- The fruit category has 3 products (2 Apples and 1 Banana), and the total quantities for the category are 20 (5 + 10 + 5).
Sum by multiple groups
Let’s calculate the sum of the Quantity group by Category and Product.
df_sales_data <- data.frame(
  Product = c("Apple", "Banana", "Apple", "Milk", "Bread", "Butter", "Milk"),
  Category = c("Fruit", "Fruit", "Fruit", "Dairy", "Bakery", "Dairy", "Dairy"),
  Price = c(1.2, 0.5, 1.2, 2.5, 1.8, 2.0, 2.5),
  Quantity = c(5, 10, 5, 2, 3, 12, 2),
  stringsAsFactors = FALSE
)

print(df_sales_data)


# Sum by Multiple Groups
aggregate(Quantity ~ Category + Product, data = df_sales_data, FUN = sum)
Output

The above figure shows that we group data frames based on Category and Product and calculate the sum of quantities for each unique product.
Sum of multiple columns by single group
Let’s calculate the sum of multiple columns (Quantity, Price) grouped by Category.
df_sales_data <- data.frame(
  Product = c("Apple", "Banana", "Apple", "Milk", "Bread", "Butter", "Milk"),
  Category = c("Fruit", "Fruit", "Fruit", "Dairy", "Bakery", "Dairy", "Dairy"),
  Price = c(1.2, 0.5, 1.2, 2.5, 1.8, 2.0, 2.5),
  Quantity = c(5, 10, 5, 2, 3, 12, 2),
  stringsAsFactors = FALSE
)

print(df_sales_data)


# Sum Multiple Columns
aggregate(cbind(Quantity, Price) ~ Category, data = df_sales_data, FUN = sum)
Output

The above figure shows the sum of multiple columns categorywise.
Method 2: Using group_by() with summarise()
The dplyr package provides an easy way to group and summarize data frame using the group_by() and summarise() functions.
The group_by() function groups data frame by categorical column.
The summarise() function applies aggregation functions like sum(), mean(), count(), etc. For example, we have already calculated the mean by group and count rows by group.
The output from dplyr functions is a tibble, which is an extended version of the data frame.
Sum by single group
library(dplyr)


df_sales_data <- data.frame(
  Product = c("Apple", "Banana", "Apple", "Milk", "Bread", "Butter", "Milk"),
  Category = c("Fruit", "Fruit", "Fruit", "Dairy", "Bakery", "Dairy", "Dairy"),
  Price = c(1.2, 0.5, 1.2, 2.5, 1.8, 2.0, 2.5),
  Quantity = c(5, 10, 5, 2, 3, 12, 2),
  stringsAsFactors = FALSE
)

print(df_sales_data)


# Using dplyr Approach
# Basic Grouped Sum

df_sales_data %>%
  group_by(Category) %>%
  summarize(Total_Quantity = sum(Quantity))
Output

Grouped sum with multiple columns
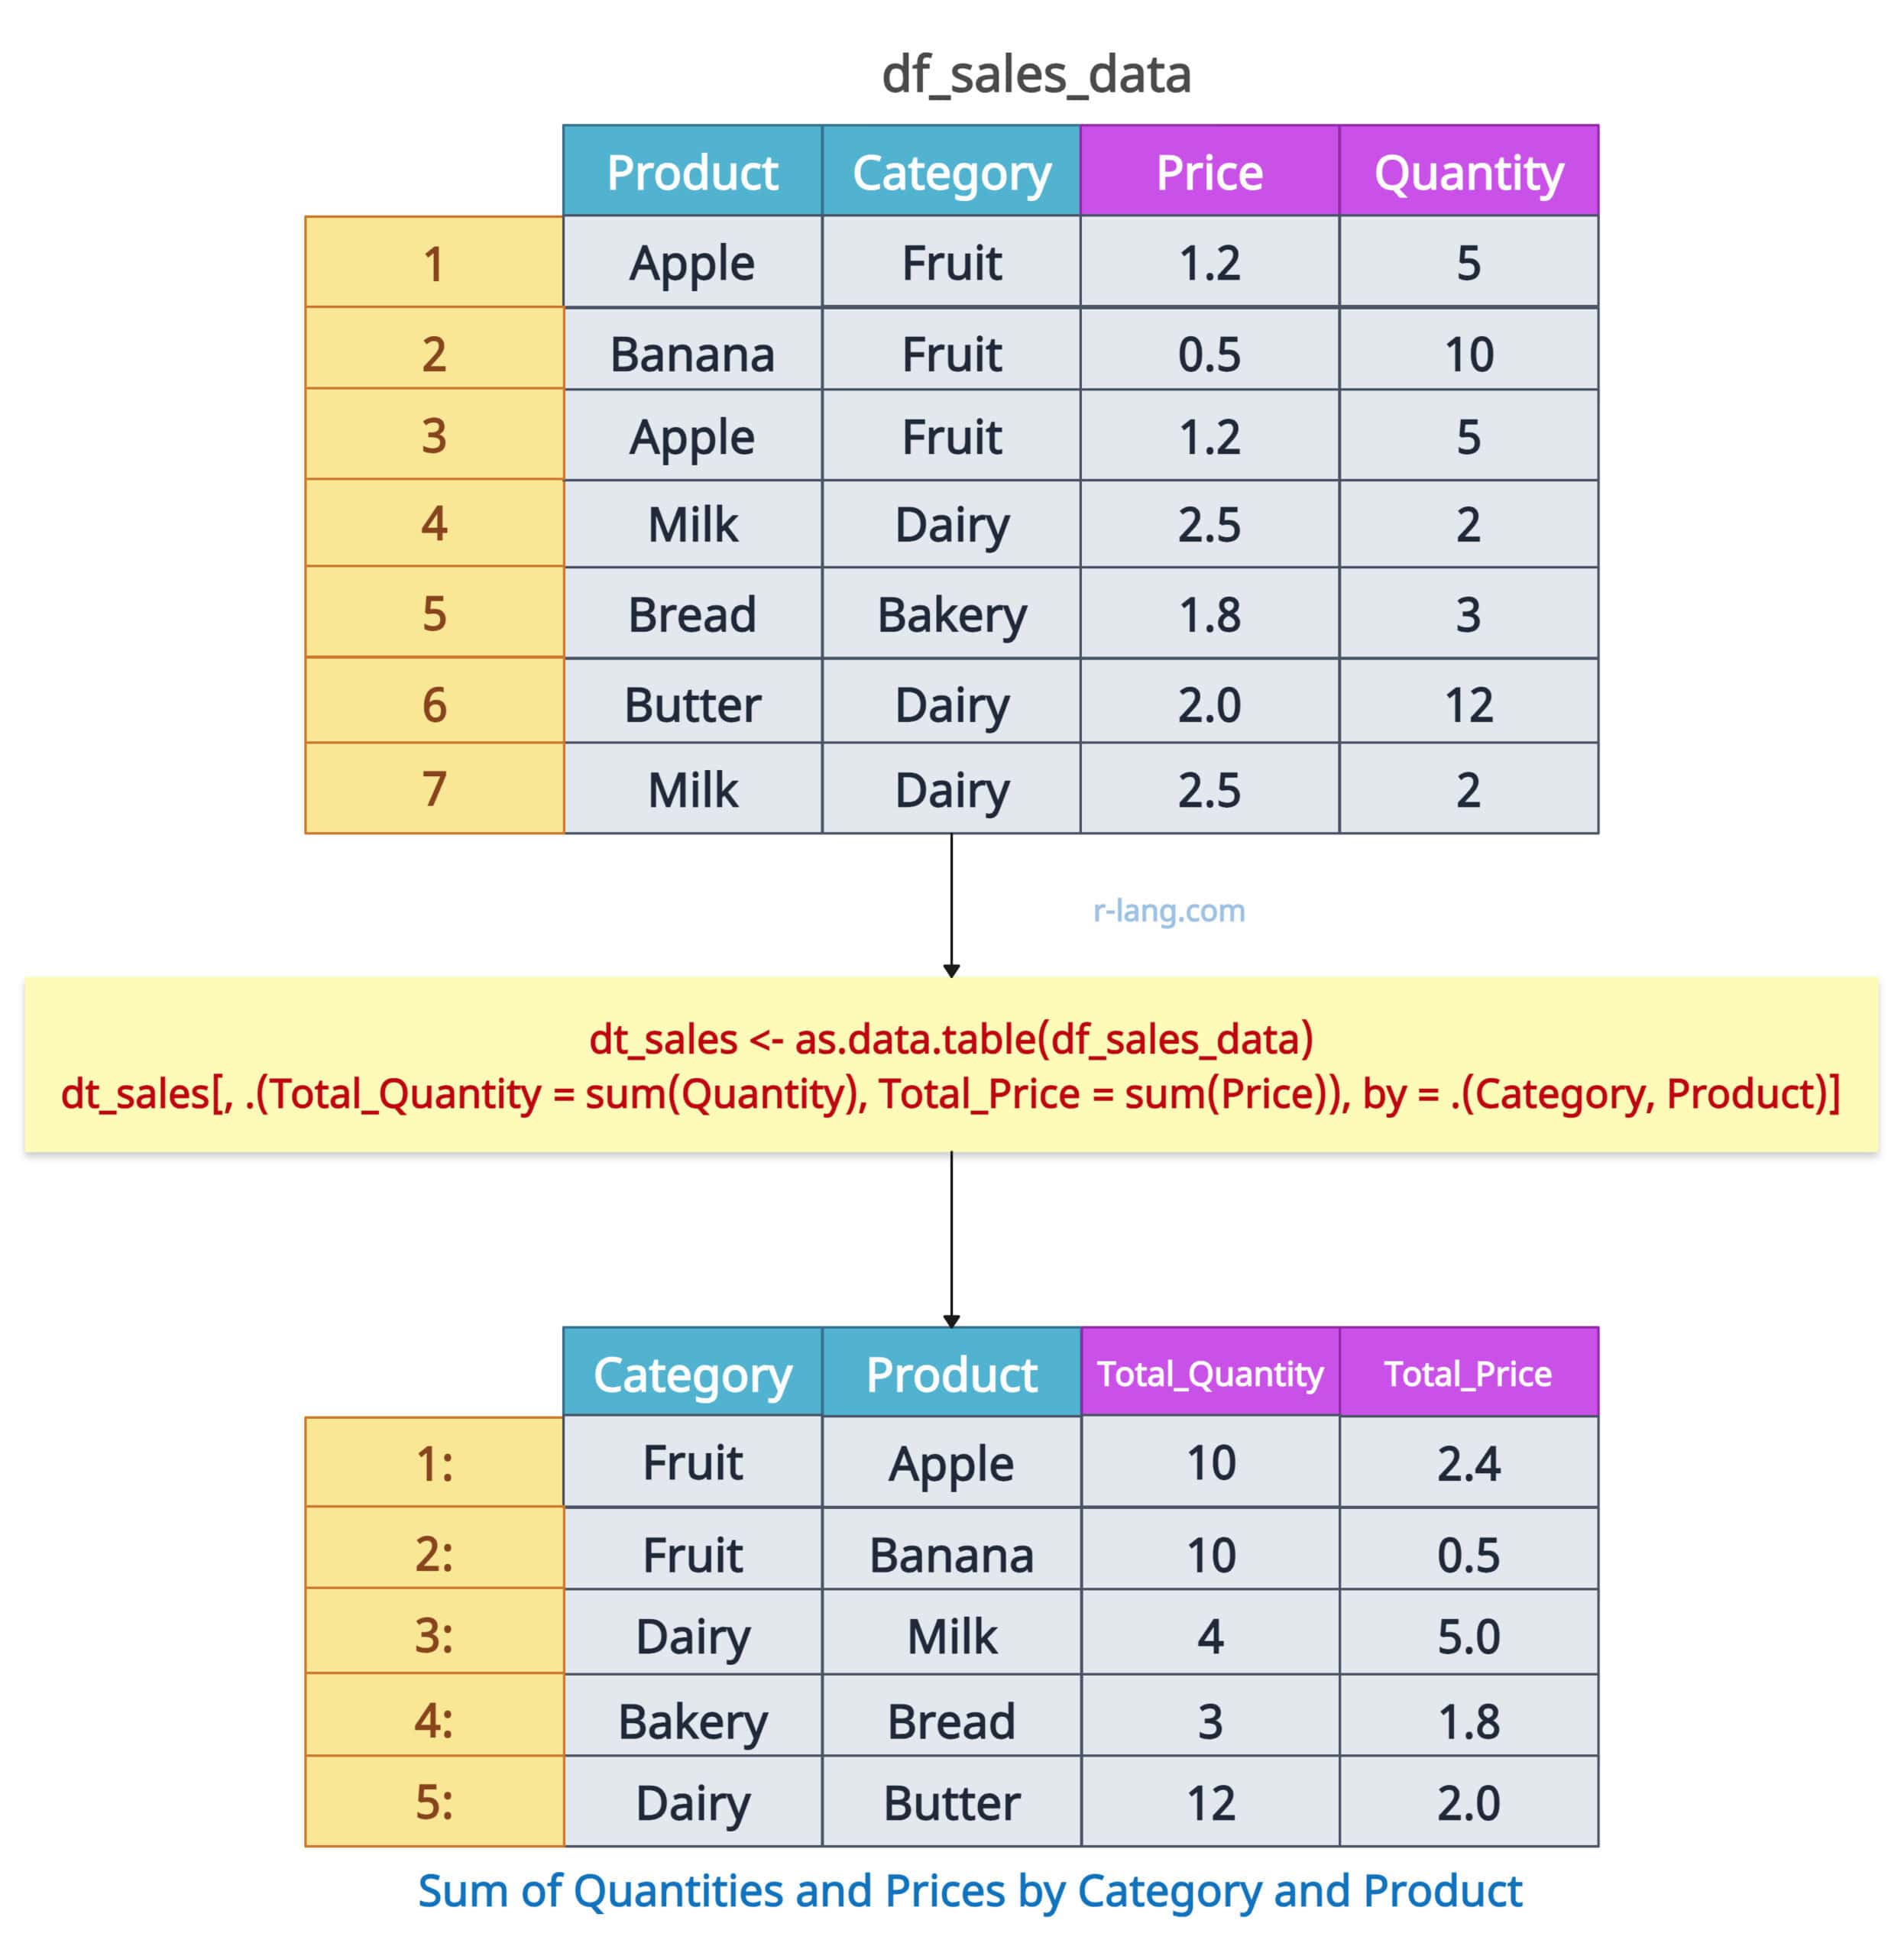
Let’s calculate the sum of the total quantity and the sum of the total price grouped by Category and Product.
library(dplyr)


df_sales_data <- data.frame(
  Product = c("Apple", "Banana", "Apple", "Milk", "Bread", "Butter", "Milk"),
  Category = c("Fruit", "Fruit", "Fruit", "Dairy", "Bakery", "Dairy", "Dairy"),
  Price = c(1.2, 0.5, 1.2, 2.5, 1.8, 2.0, 2.5),
  Quantity = c(5, 10, 5, 2, 3, 12, 2),
  stringsAsFactors = FALSE
)

print(df_sales_data)


# Grouped Sum with Multiple Columns
df_sales_data %>%
  group_by(Category, Product) %>%
  summarize(Total_Quantity = sum(Quantity), Total_Price = sum(Price))
Output
 Sum all numeric columns

If you want to sum all numeric columns while grouping by one column, you can use group_by(), summarise(), across(), where(), and is.numeric() in dplyr.
library(dplyr)


df_sales_data <- data.frame(
  Product = c("Apple", "Banana", "Apple", "Milk", "Bread", "Butter", "Milk"),
  Category = c("Fruit", "Fruit", "Fruit", "Dairy", "Bakery", "Dairy", "Dairy"),
  Price = c(1.2, 0.5, 1.2, 2.5, 1.8, 2.0, 2.5),
  Quantity = c(5, 10, 5, 2, 3, 12, 2),
  stringsAsFactors = FALSE
)

print(df_sales_data)


# Sum All Numeric Columns

df_sales_data %>%
  group_by(Category) %>%
  summarise(across(where(is.numeric), sum))
Output
 Method 3: Using data.table package

The data.table package provides a highly optimized way to perform data manipulation.
Basic grouped sum
library(data.table)


df_sales_data <- data.frame(
  Product = c("Apple", "Banana", "Apple", "Milk", "Bread", "Butter", "Milk"),
  Category = c("Fruit", "Fruit", "Fruit", "Dairy", "Bakery", "Dairy", "Dairy"),
  Price = c(1.2, 0.5, 1.2, 2.5, 1.8, 2.0, 2.5),
  Quantity = c(5, 10, 5, 2, 3, 12, 2),
  stringsAsFactors = FALSE
)

print(df_sales_data)


# Convert to data.table
dt_sales <- as.data.table(df_sales_data)

# Basic Grouped Sum
dt_sales[, .(Total_Quantity = sum(Quantity)), by = Category]
Output

Grouped sum with multiple columns
library(data.table)


df_sales_data <- data.frame(
  Product = c("Apple", "Banana", "Apple", "Milk", "Bread", "Butter", "Milk"),
  Category = c("Fruit", "Fruit", "Fruit", "Dairy", "Bakery", "Dairy", "Dairy"),
  Price = c(1.2, 0.5, 1.2, 2.5, 1.8, 2.0, 2.5),
  Quantity = c(5, 10, 5, 2, 3, 12, 2),
  stringsAsFactors = FALSE
)

print(df_sales_data)


# Convert to data.table
dt_sales <- as.data.table(df_sales_data)


# Grouped Sum with Multiple Columns
dt_sales[, .(Total_Quantity = sum(Quantity), Total_Price = sum(Price)), by = .(Category, Product)]
Output
 If your data set is very large, I highly recommend you use data.table package for the efficient performance.

Krunal Lathiya is a seasoned Computer Science expert with over eight years in the tech industry. He boasts deep knowledge in Data Science and Machine Learning. Versed in Python, JavaScript, PHP, R, and Golang. Skilled in frameworks like Angular and React and platforms such as Node.js. His expertise spans both front-end and back-end development. His proficiency in the Python language stands as a testament to his versatility and commitment to the craft.