To count the number of rows by group in R, you can either use the dplyr::count(), dplyr::group_by() with tally(), or dplyr::group_by() with summarize(n = n()) functions, each suited for different use cases.
By a single group
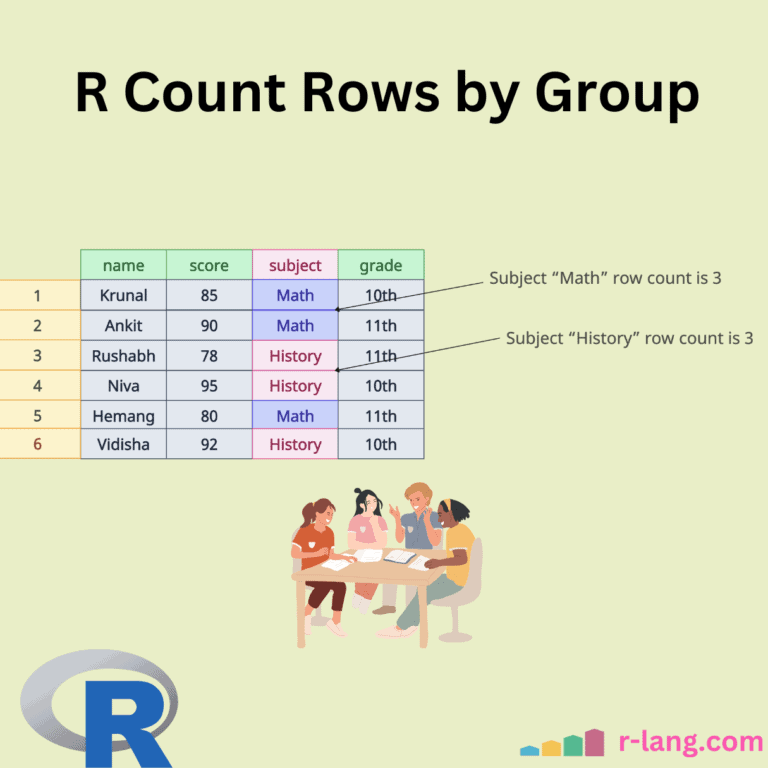
Counting observations by a single group variable means grouping the dataset based on a single column. For example, you want to count the number of students subject-wise. Here, the subject is the single variable.
Using count()
If you want to count observations group-wise in a single line of code, use the count() function. It accepts the group variable as an argument and returns a data frame with an “n” column to count the number of observations.
The output is ungrouped by default, which avoids accidental grouped operations. It supports built-in arguments for sorting (sort), renaming (name), and handling NA/factor levels (.drop).
However, it does not provide a multistate summary (mean, max, median) and only returns a count of rows.
library(dplyr)

df_students_grade <- df <- data.frame(
  name = c("Krunal", "Ankit", "Rushabh", "Niva", "Hemang", "Vidisha"),
  score = c(85, 90, 78, 95, 80, 92),
  subject = c("Math", "Math", "History", "History", "Math", "History"),
  grade = c("10th", "11th", "11th", "10th", "11th", "10th")
)

print(df_students_grade)

# Count Rows by Single Variable Group using count()

df_students_grade %>% count(subject)
Output

The above output figure illustrates that we used a single grouping variable, “subject”, categorized the rows, and calculated the total number of observations per subject.
You can sort the result of the count by passing sort = TRUE to the count() function.
df_students_grade %>% count(subject, sort = TRUE)
Weighted Counts
What if, instead of counting the number of observations, you want to sum a specific variable’s value for each group? Let’s calculate the total number of scores for each subject.
For weighted count, pass the “wt” argument to the count() function.
library(dplyr)

df_students_grade <- df <- data.frame(
  name = c("Krunal", "Ankit", "Rushabh", "Niva", "Hemang", "Vidisha"),
  score = c(85, 90, 78, 95, 80, 92),
  subject = c("Math", "Math", "History", "History", "Math", "History"),
  grade = c("10th", "11th", "11th", "10th", "11th", "10th")
)

print(df_students_grade)

# Weighted Counts
df_students_grade %>% count(subject, wt = score, name = "total_score")
Output
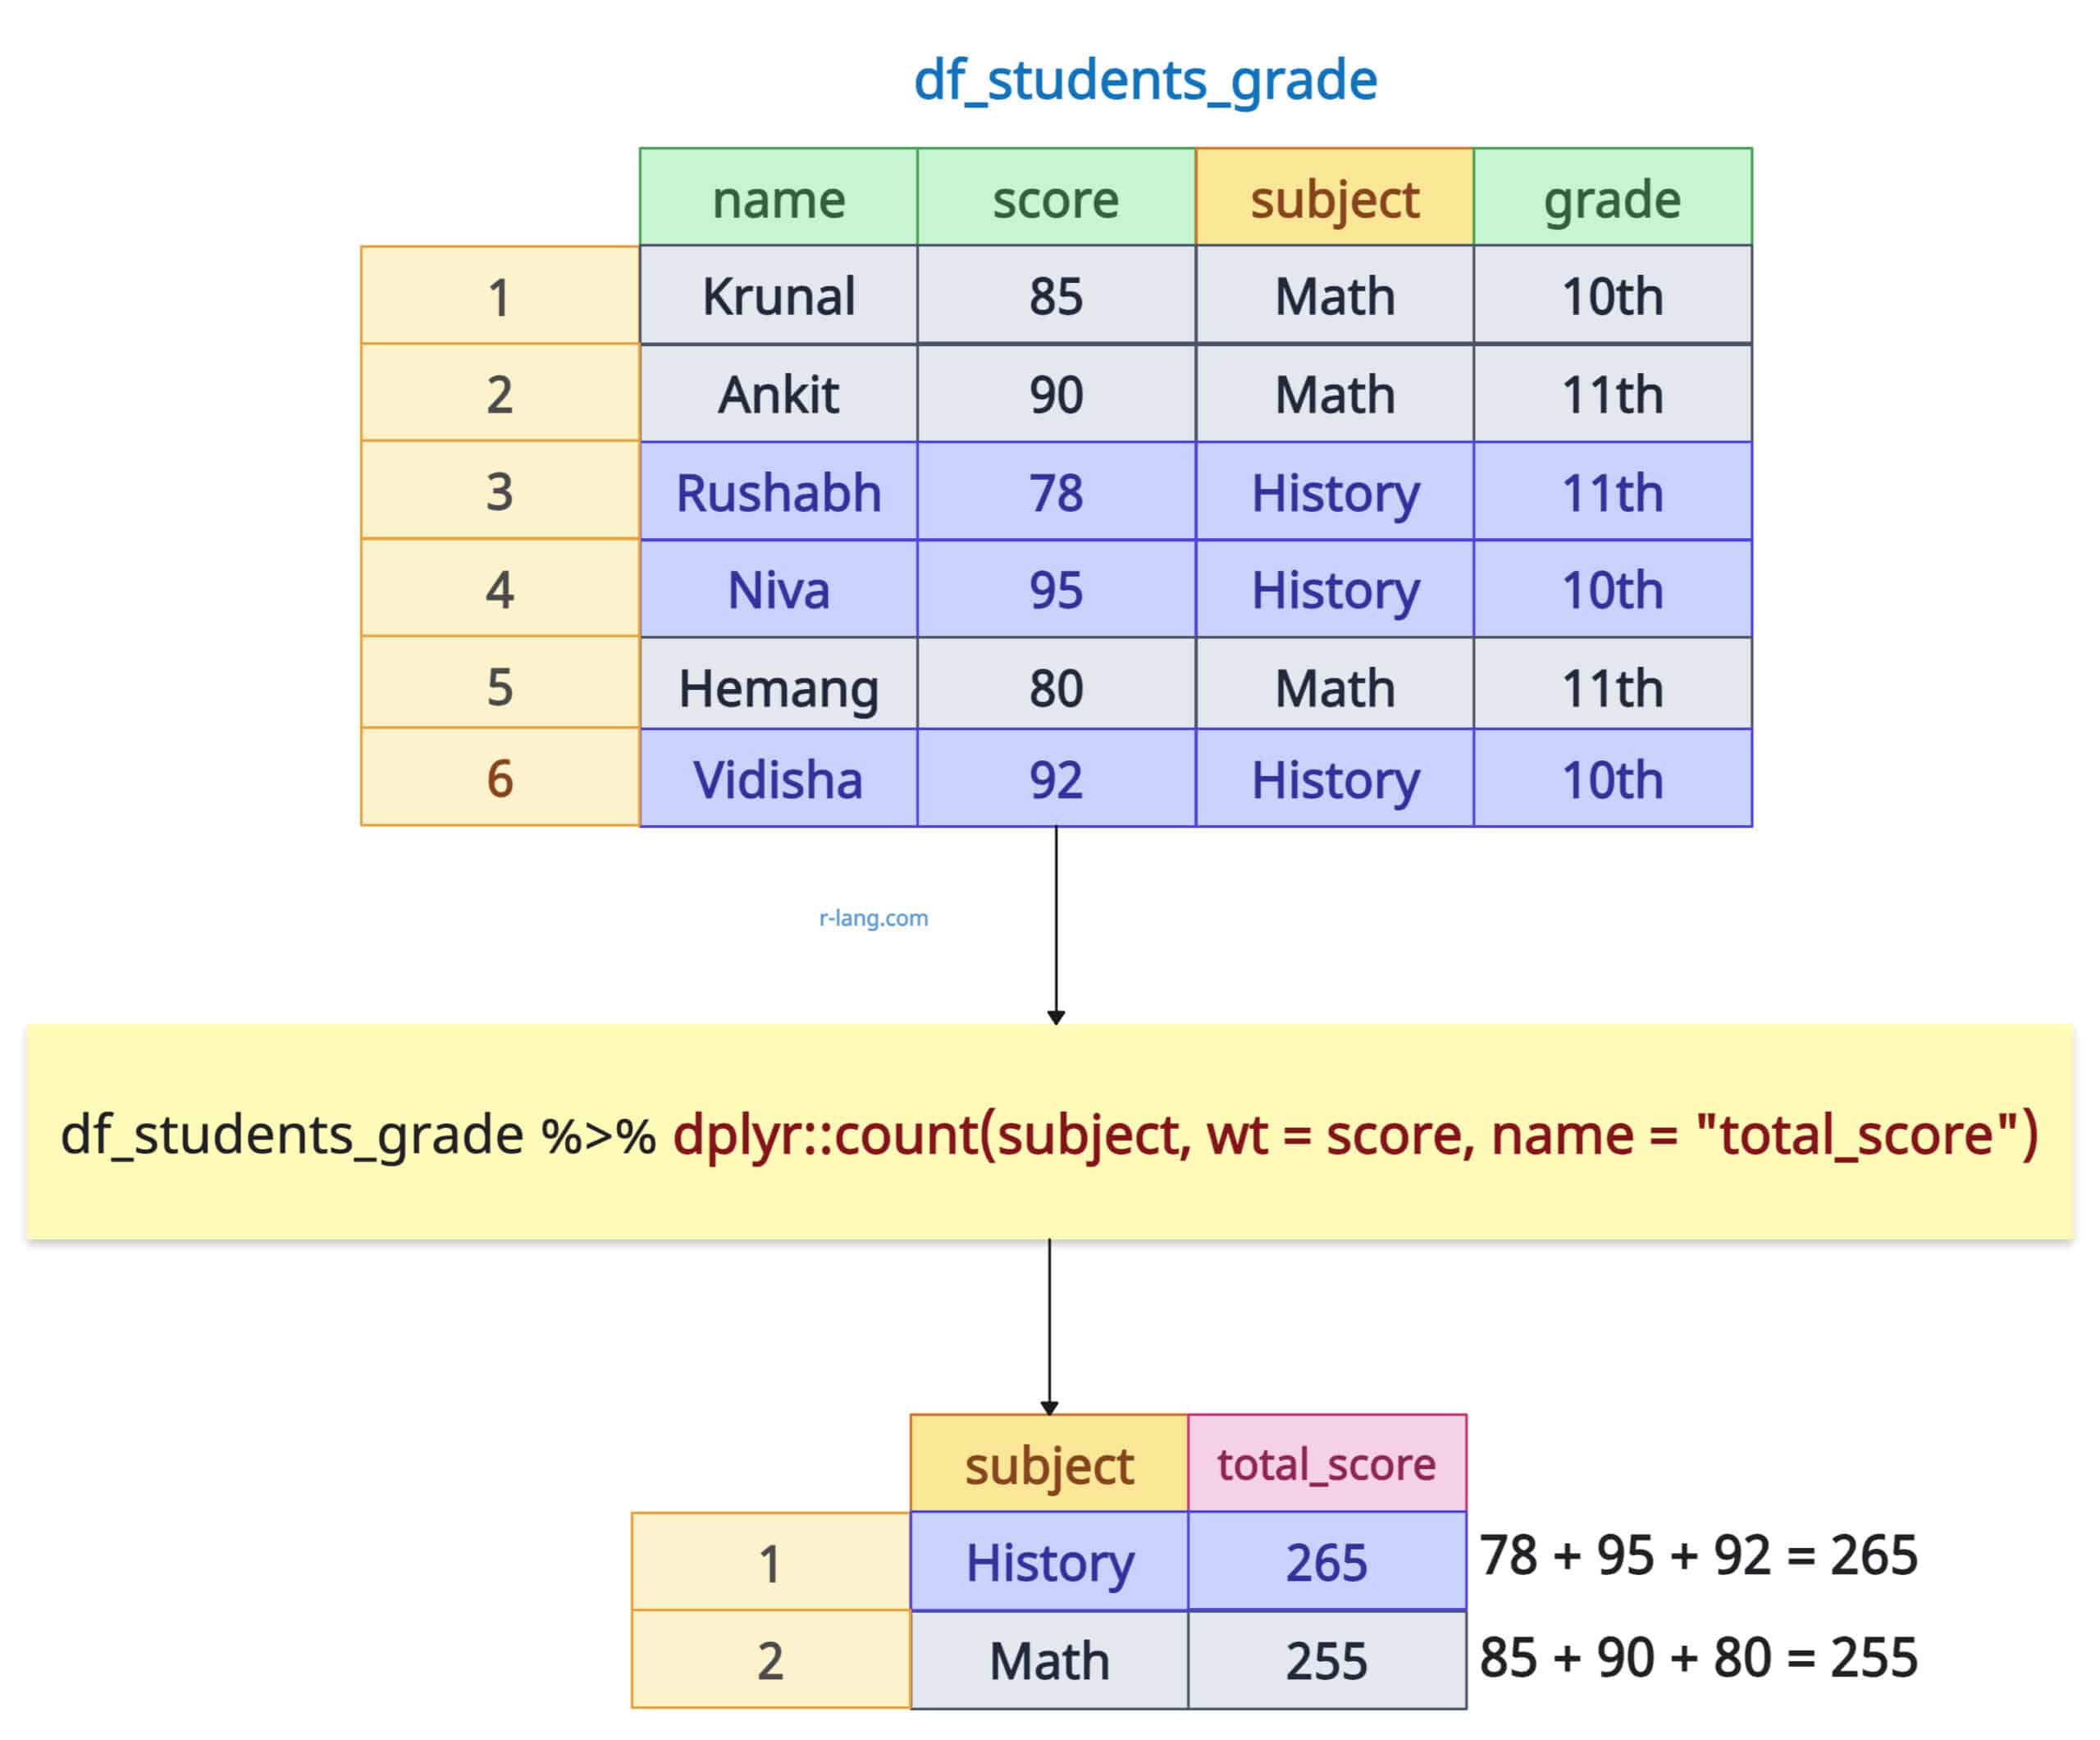
The output is the sum of the total score subject-wise.
Retain Zero-Count Groups
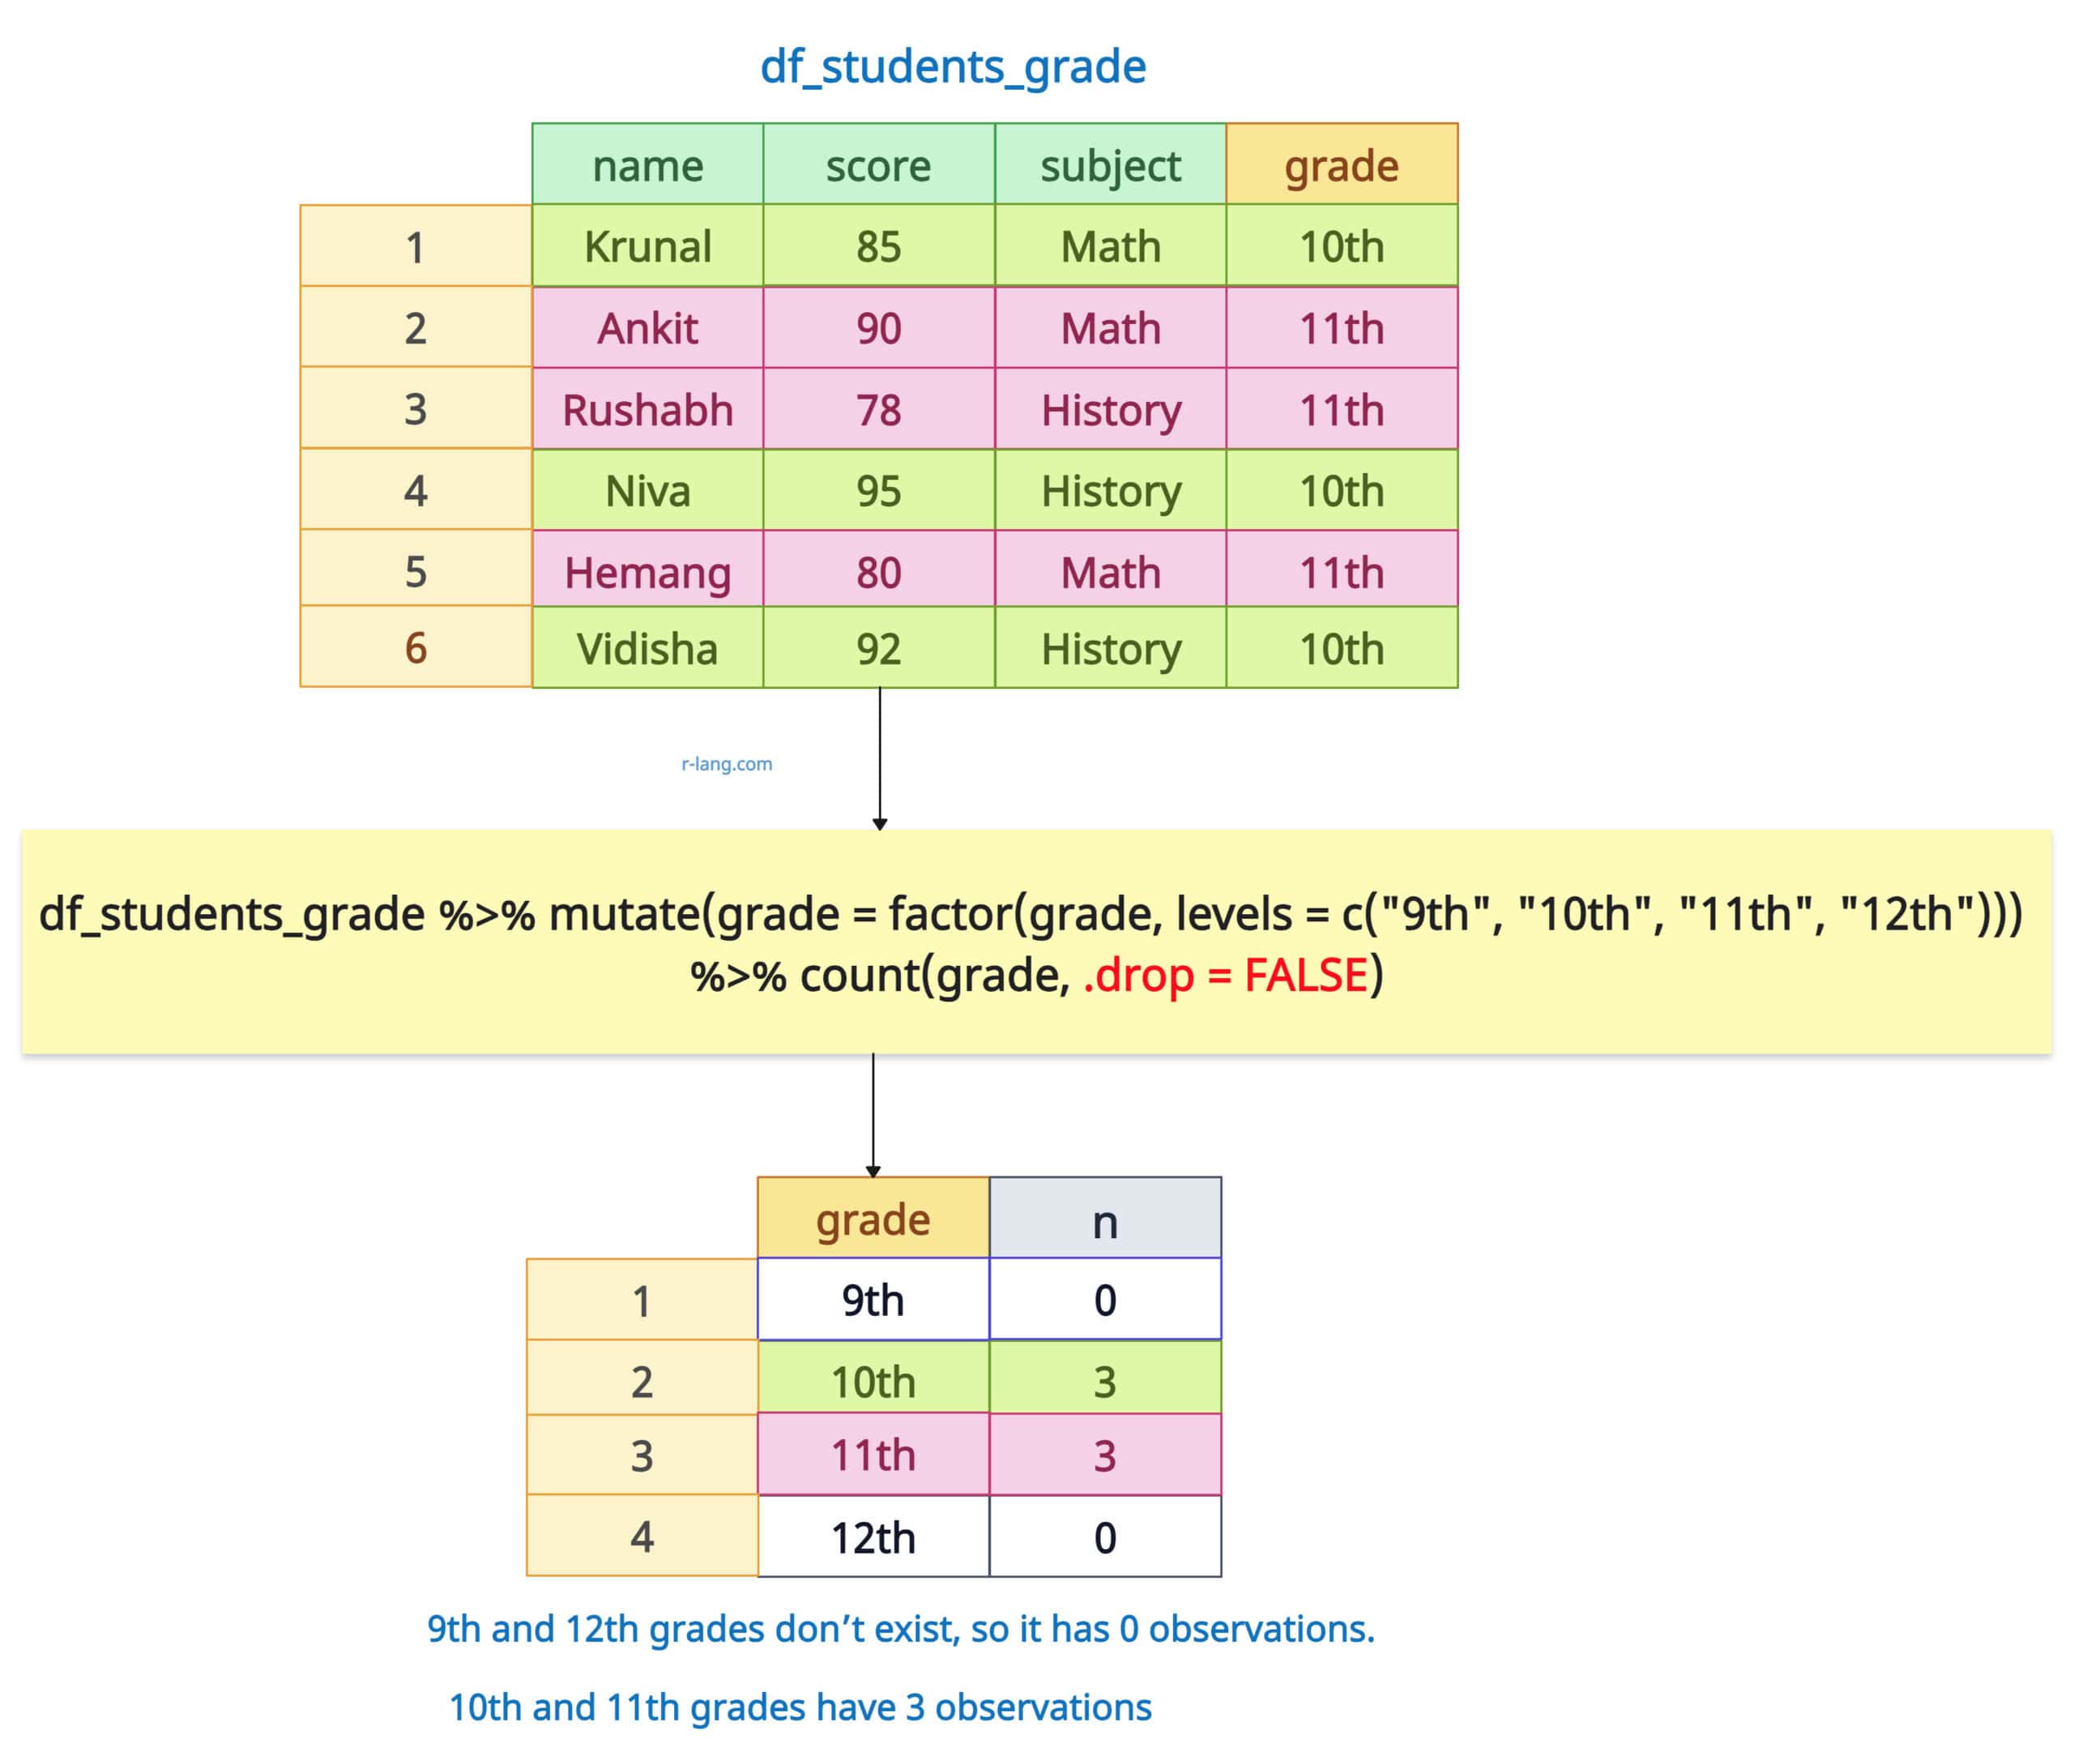
Let’s count students in each grade and retain zero-count groups in the final output. We will include all factor levels (even empty ones).
library(dplyr)

df_students_grade <- df <- data.frame(
  name = c("Krunal", "Ankit", "Rushabh", "Niva", "Hemang", "Vidisha"),
  score = c(85, 90, 78, 95, 80, 92),
  subject = c("Math", "Math", "History", "History", "Math", "History"),
  grade = c("10th", "11th", "11th", "10th", "11th", "10th")
)

print(df_students_grade)

# Retain Zero-Count Groups
df_students_grade %>%
  mutate(grade = factor(grade, levels = c("9th", "10th", "11th", "12th"))) %>%
  count(grade, .drop = FALSE)
Output
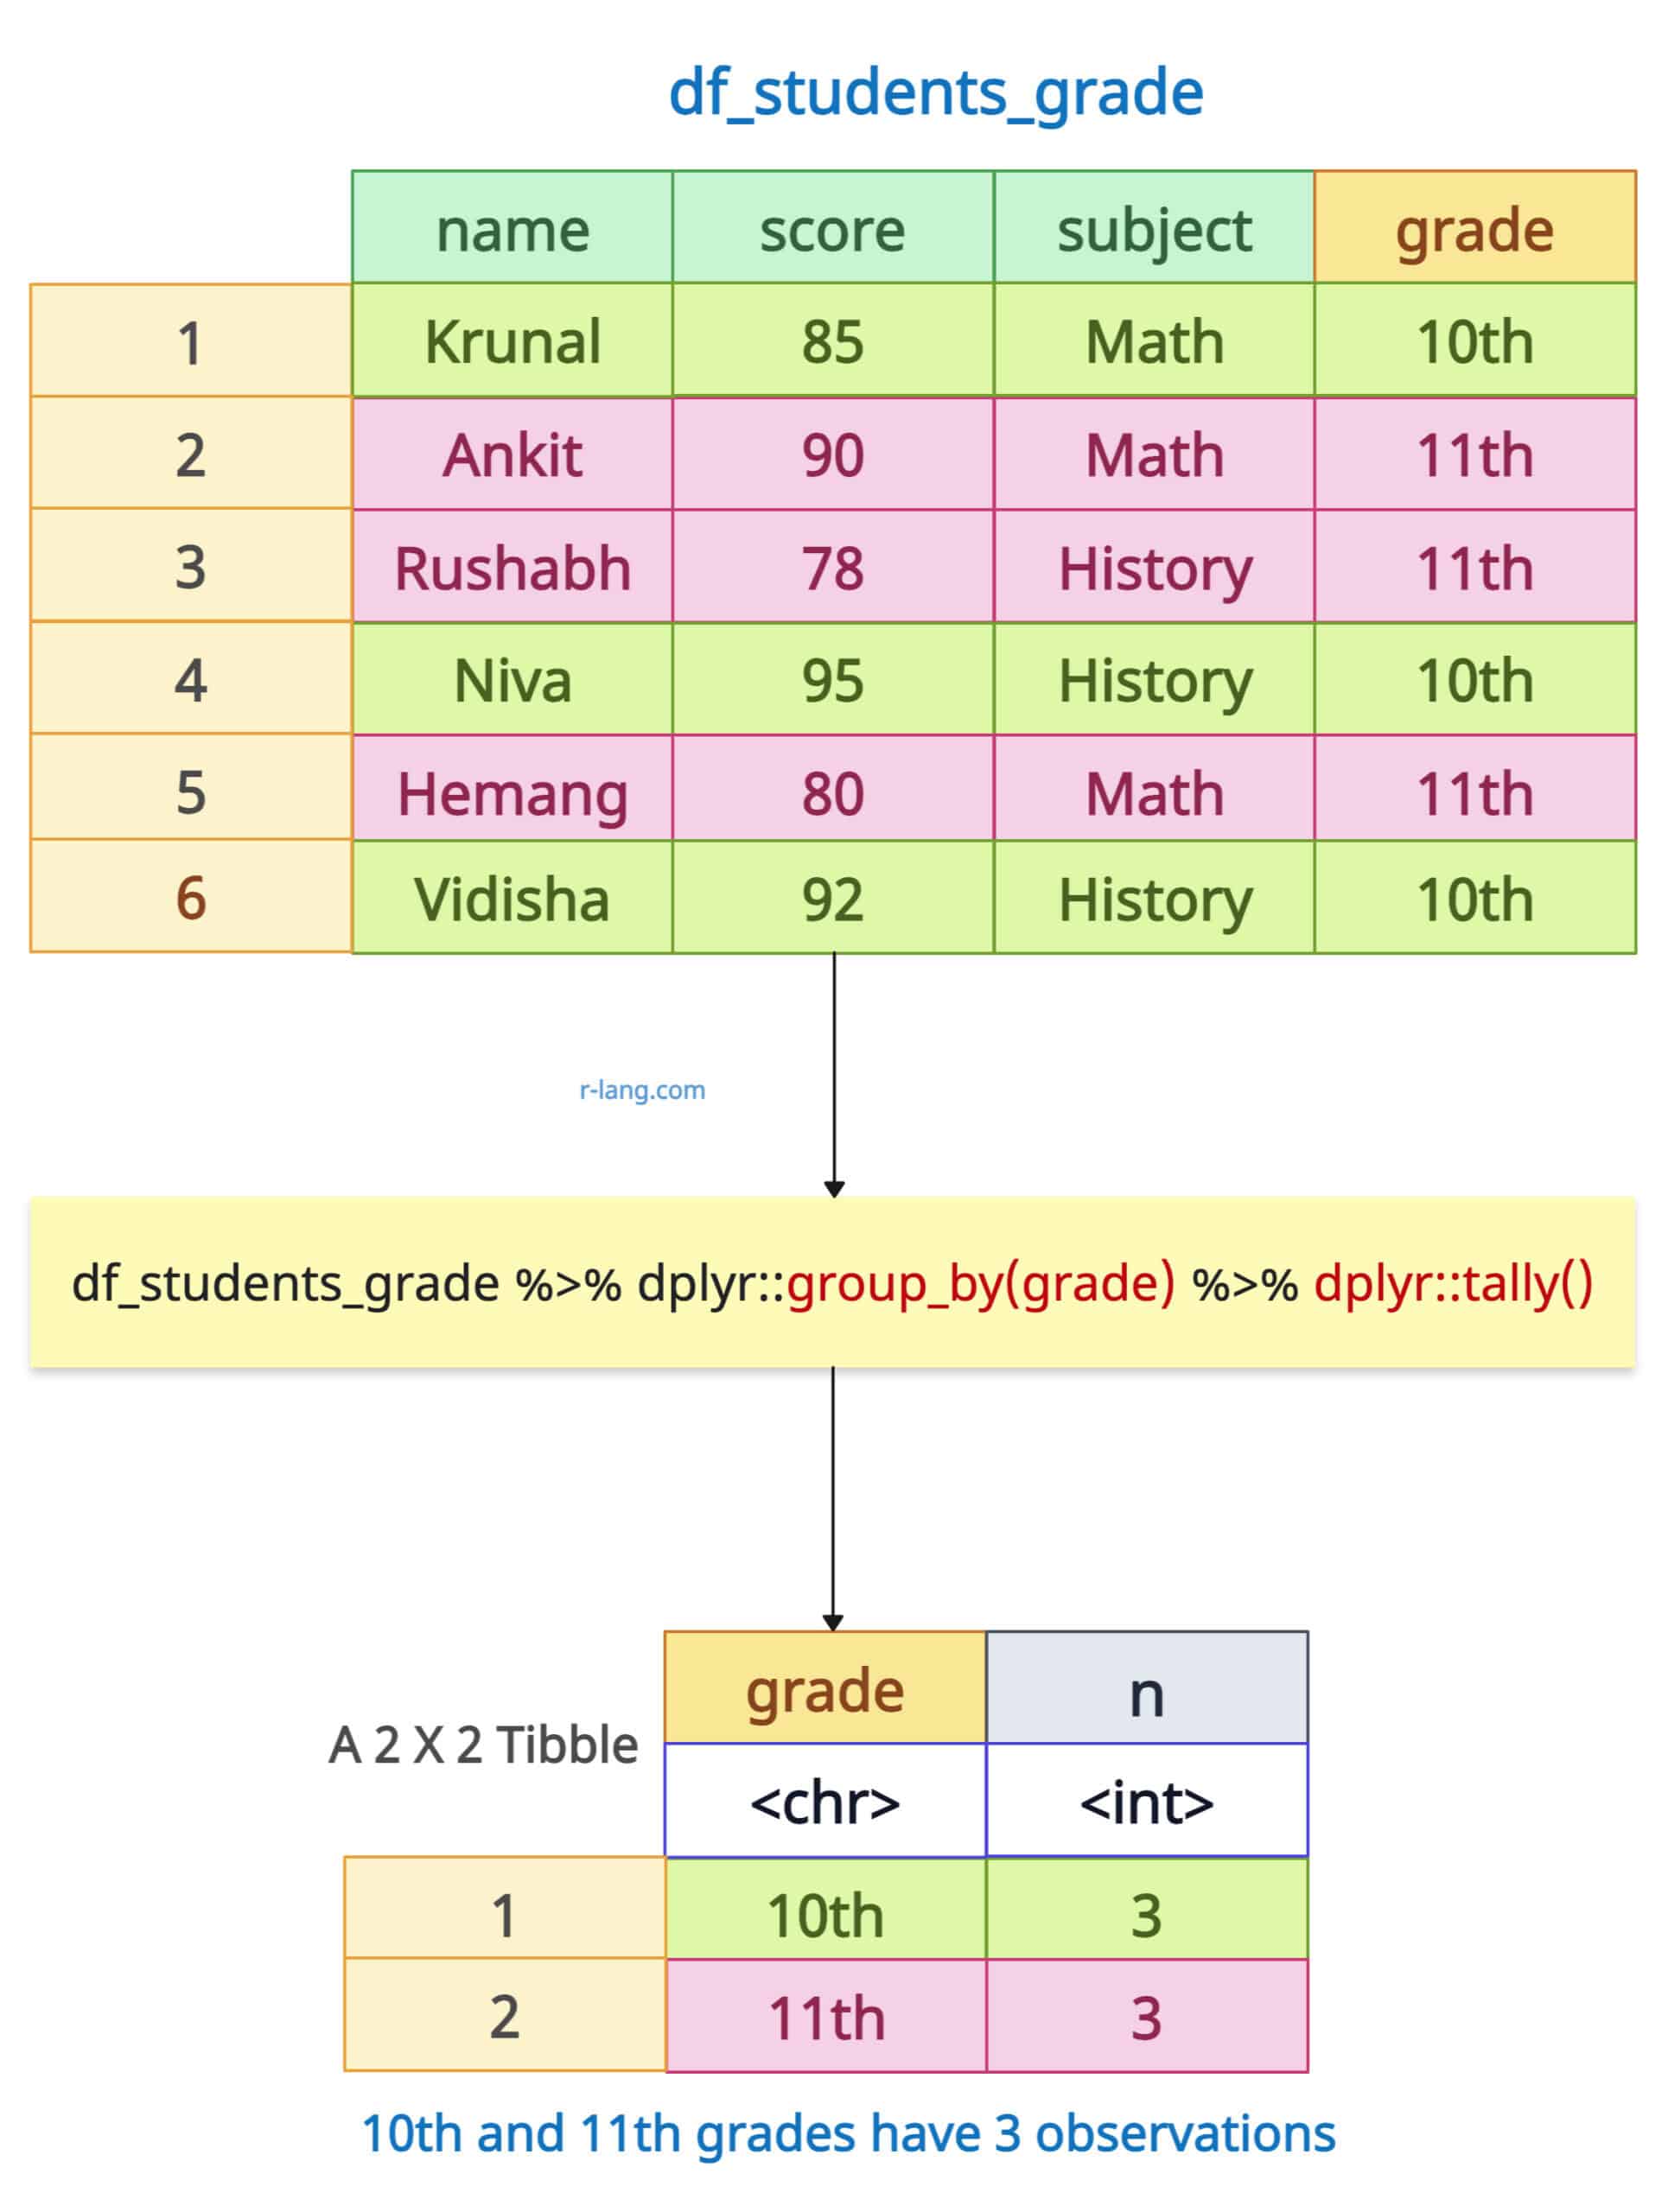
Using tally()
The dplyr::tally() function performs the summarize(n = n()) on grouped data. It returns the tibble as output.
library(dplyr)

df_students_grade <- df <- data.frame(
  name = c("Krunal", "Ankit", "Rushabh", "Niva", "Hemang", "Vidisha"),
  score = c(85, 90, 78, 95, 80, 92),
  subject = c("Math", "Math", "History", "History", "Math", "History"),
  grade = c("10th", "11th", "11th", "10th", "11th", "10th")
)

print(df_students_grade)

# Count Rows by "grade" using tally()
df_students_grade %>%
  group_by(grade) %>%
  tally()
Output
It inherits existing groups if the data is pre-grouped. The tally() function also supports the “wt” argument to sum values instead of counting rows.
However, it is primarily designed for counting/summing. You cannot perform statistical operations, such as calculating the mean, median, etc.
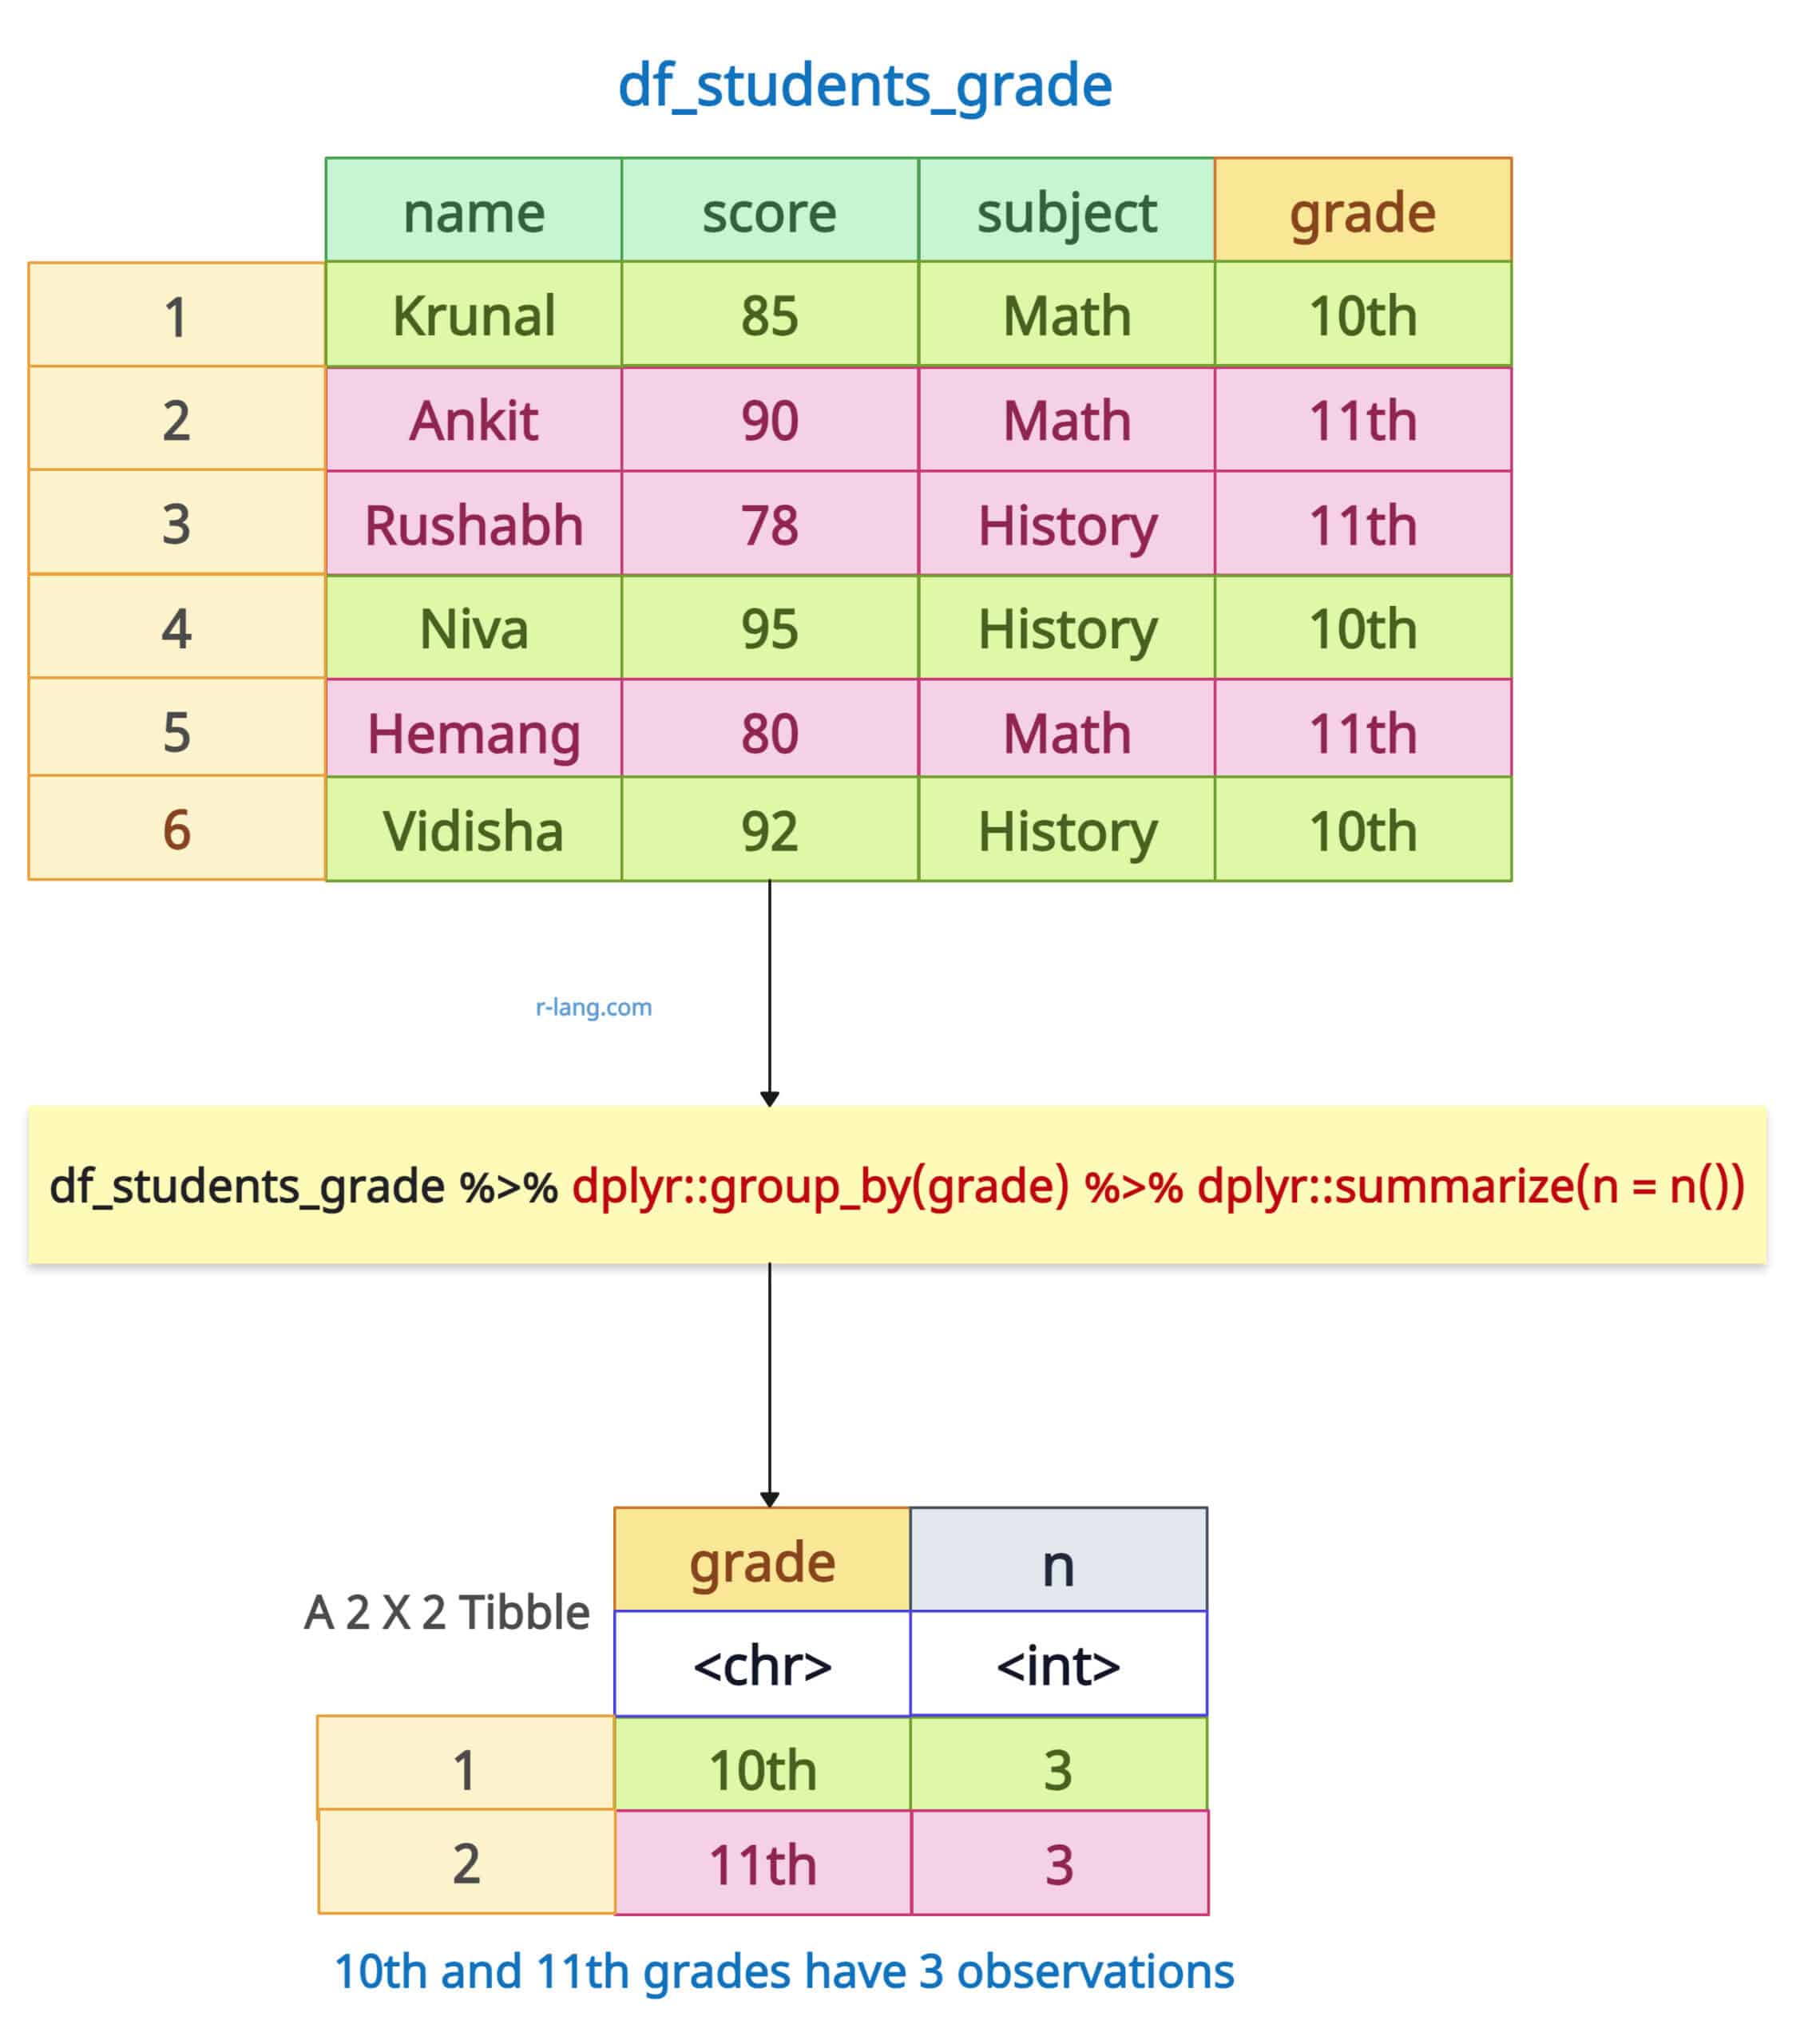
Using group_by() + summarize(n = n())
The group_by() function explicitly groups the data based on the provided variable, and the summarize(n = n()) function calculates the number of rows per group.
library(dplyr)

df_students_grade <- df <- data.frame(
  name = c("Krunal", "Ankit", "Rushabh", "Niva", "Hemang", "Vidisha"),
  score = c(85, 90, 78, 95, 80, 92),
  subject = c("Math", "Math", "History", "History", "Math", "History"),
  grade = c("10th", "11th", "11th", "10th", "11th", "10th")
)

print(df_students_grade)

# Count Rows by "grade" using summarize(n = n()) and group_by()
df_students_grade %>%
  group_by(grade) %>%
  summarize(n = n())
Output
Counting rows by multiple groups
Until now, we have used only one group variable; however, in this section, we will group the data frame based on two variables and count observations based on the combination of those groups.
Using dplyr::count()
The dplyr::count() function accepts multiple group variables and returns the grouped count.
library(dplyr)

df_students_grade <- df <- data.frame(
  name = c("Krunal", "Ankit", "Rushabh", "Niva", "Hemang", "Vidisha"),
  score = c(85, 90, 78, 95, 80, 92),
  subject = c("Math", "Math", "History", "History", "Math", "History"),
  grade = c("10th", "11th", "11th", "10th", "11th", "10th")
)

print(df_students_grade)

# Multiple Groups using count()
df_students_grade %>% count(subject, grade)
Output
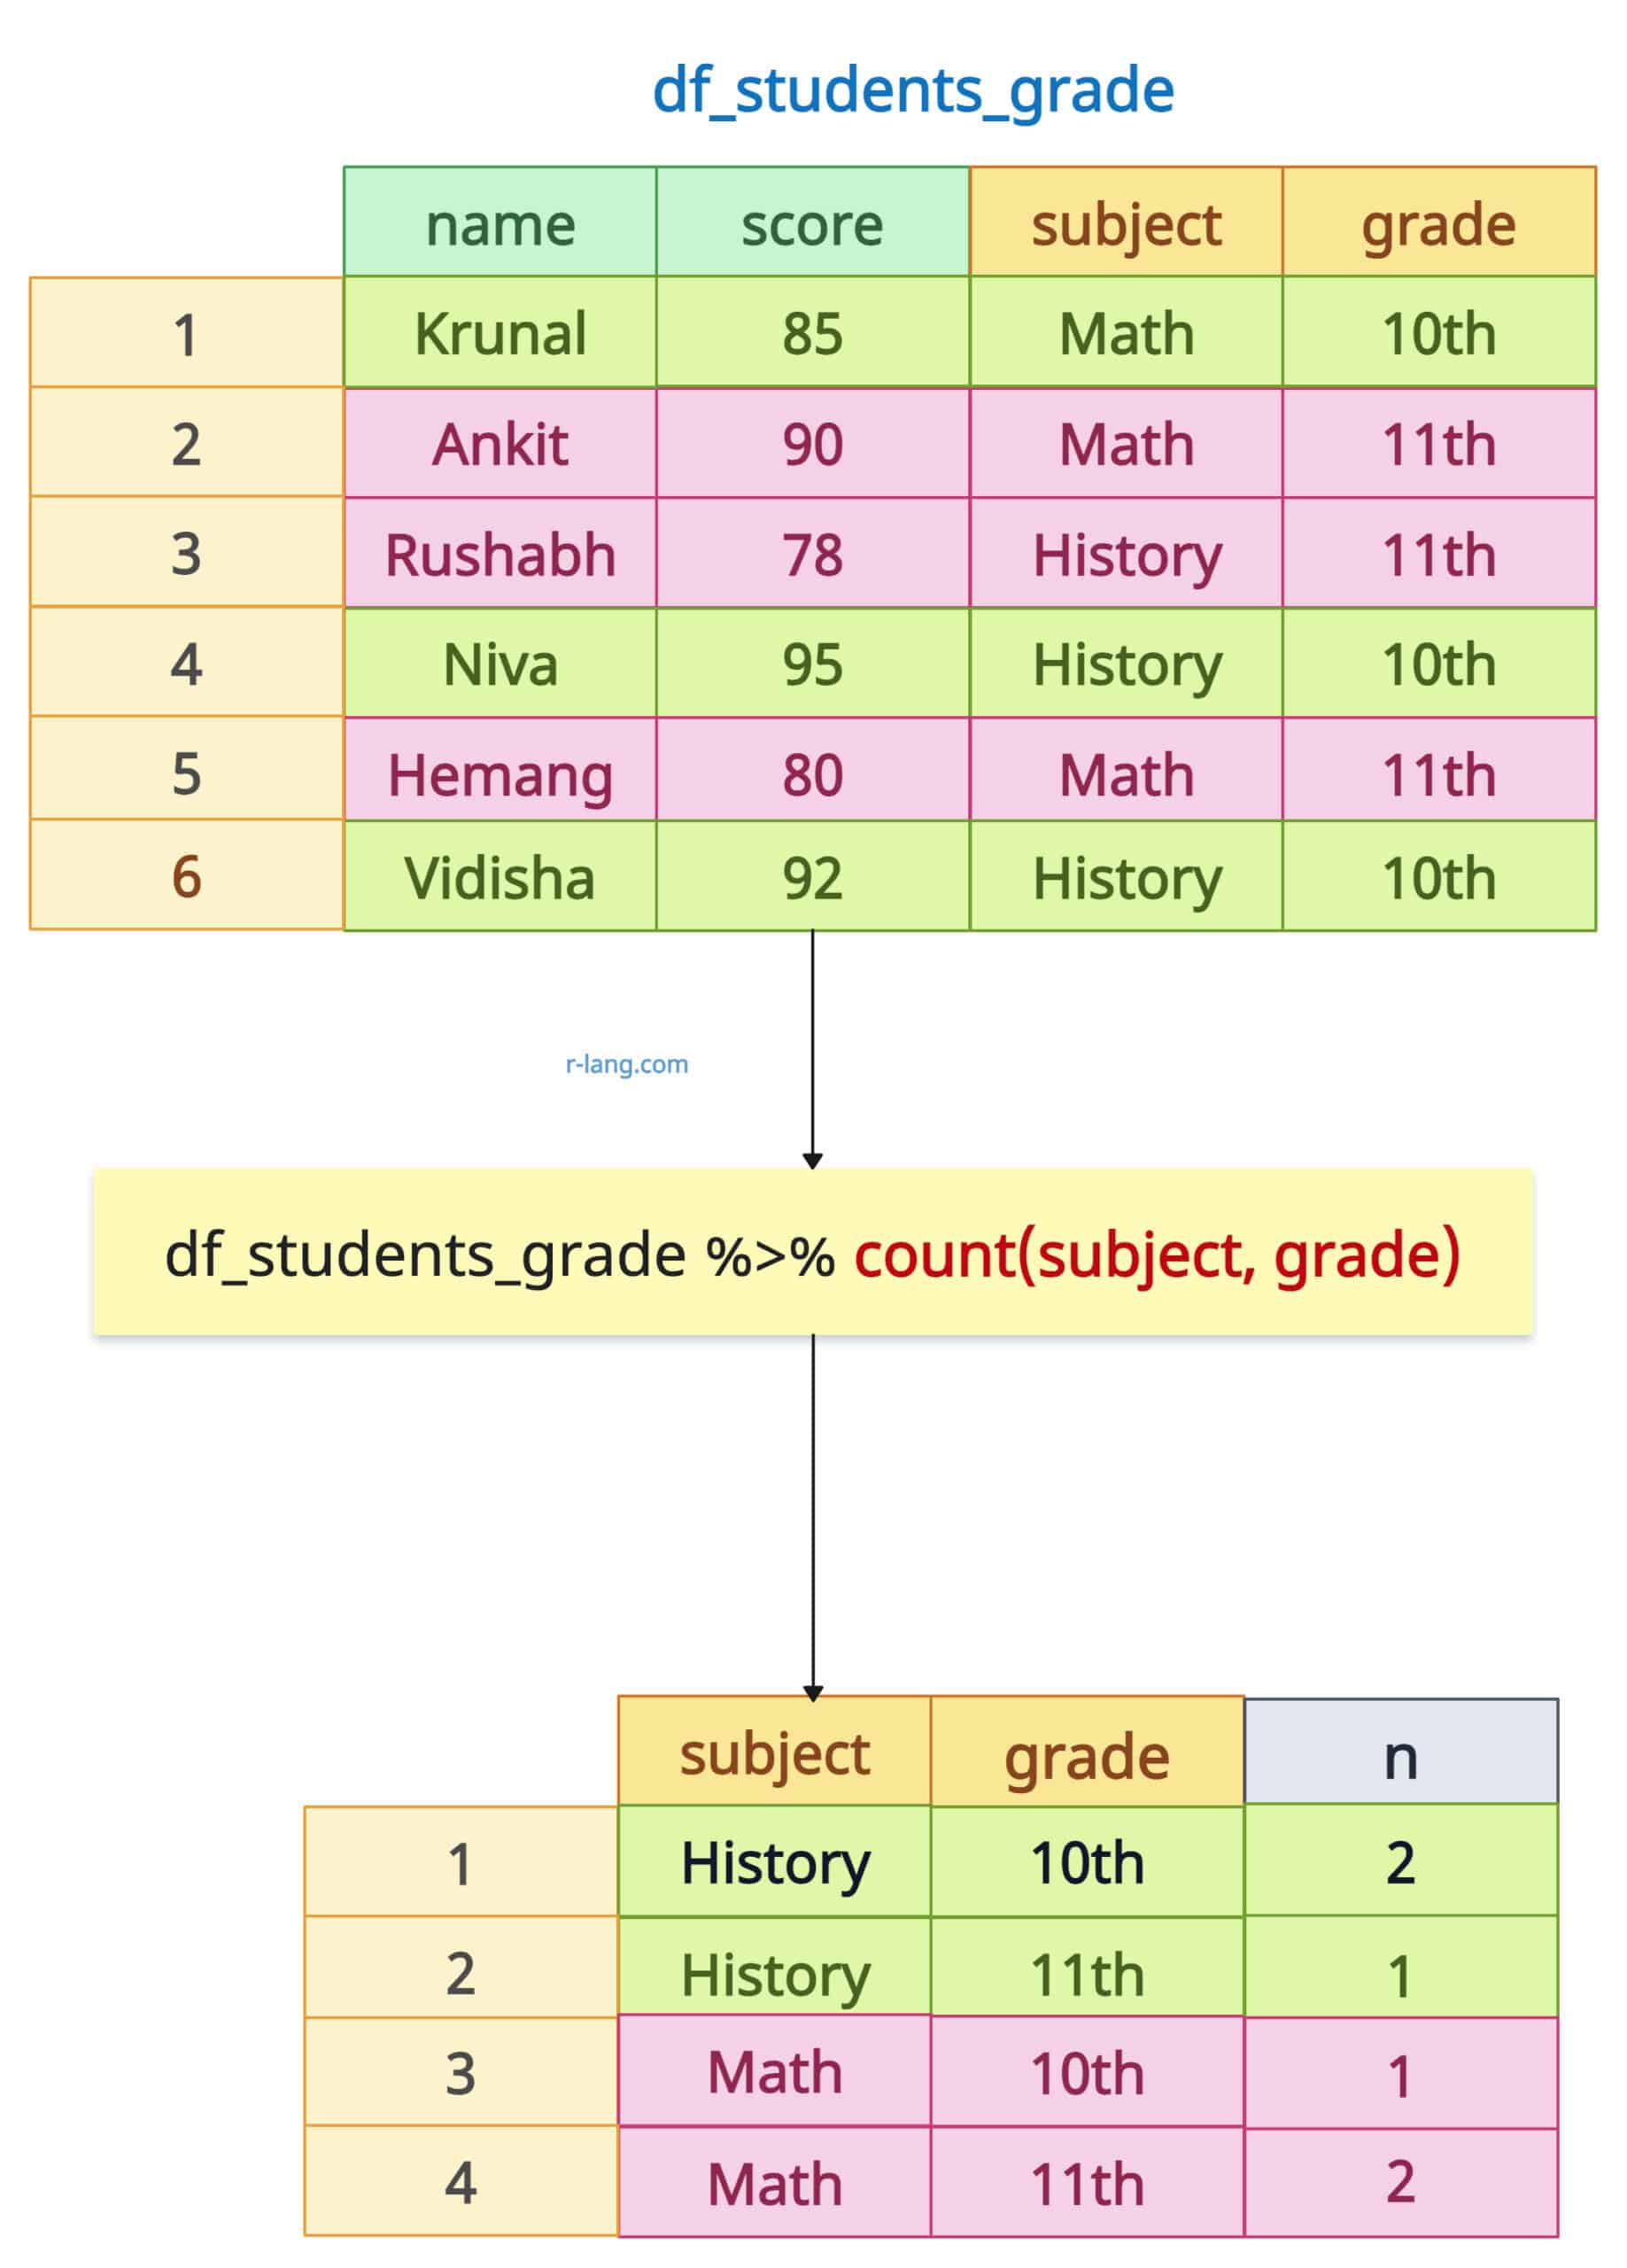
The above output figure shows that we are counting a combination of two groups’ observations: the combination of subject and grade.
History and 10th appear two times, so n returns 2. Math and 10th appear two times, so n returns 2.
History and 11th and Math and 10th appear 1-1 times.
Using dplyr::group_by() and dplyr::summarize(n = n())
You can use dplyr::group_by() with multiple variables to create a grouped data frame and then apply summarize(n = n()) to count the number of observations for each unique combination of those variables.
library(dplyr)

df_students_grade <- df <- data.frame(
  name = c("Krunal", "Ankit", "Rushabh", "Niva", "Hemang", "Vidisha"),
  score = c(85, 90, 78, 95, 80, 92),
  subject = c("Math", "Math", "History", "History", "Math", "History"),
  grade = c("10th", "11th", "11th", "10th", "11th", "10th")
)

print(df_students_grade)

# Multiple Groups using group_by() and summarize()
df_students_grade %>%
  group_by(subject, grade) %>%
  summarize(n = n(), .groups = "drop")
Output
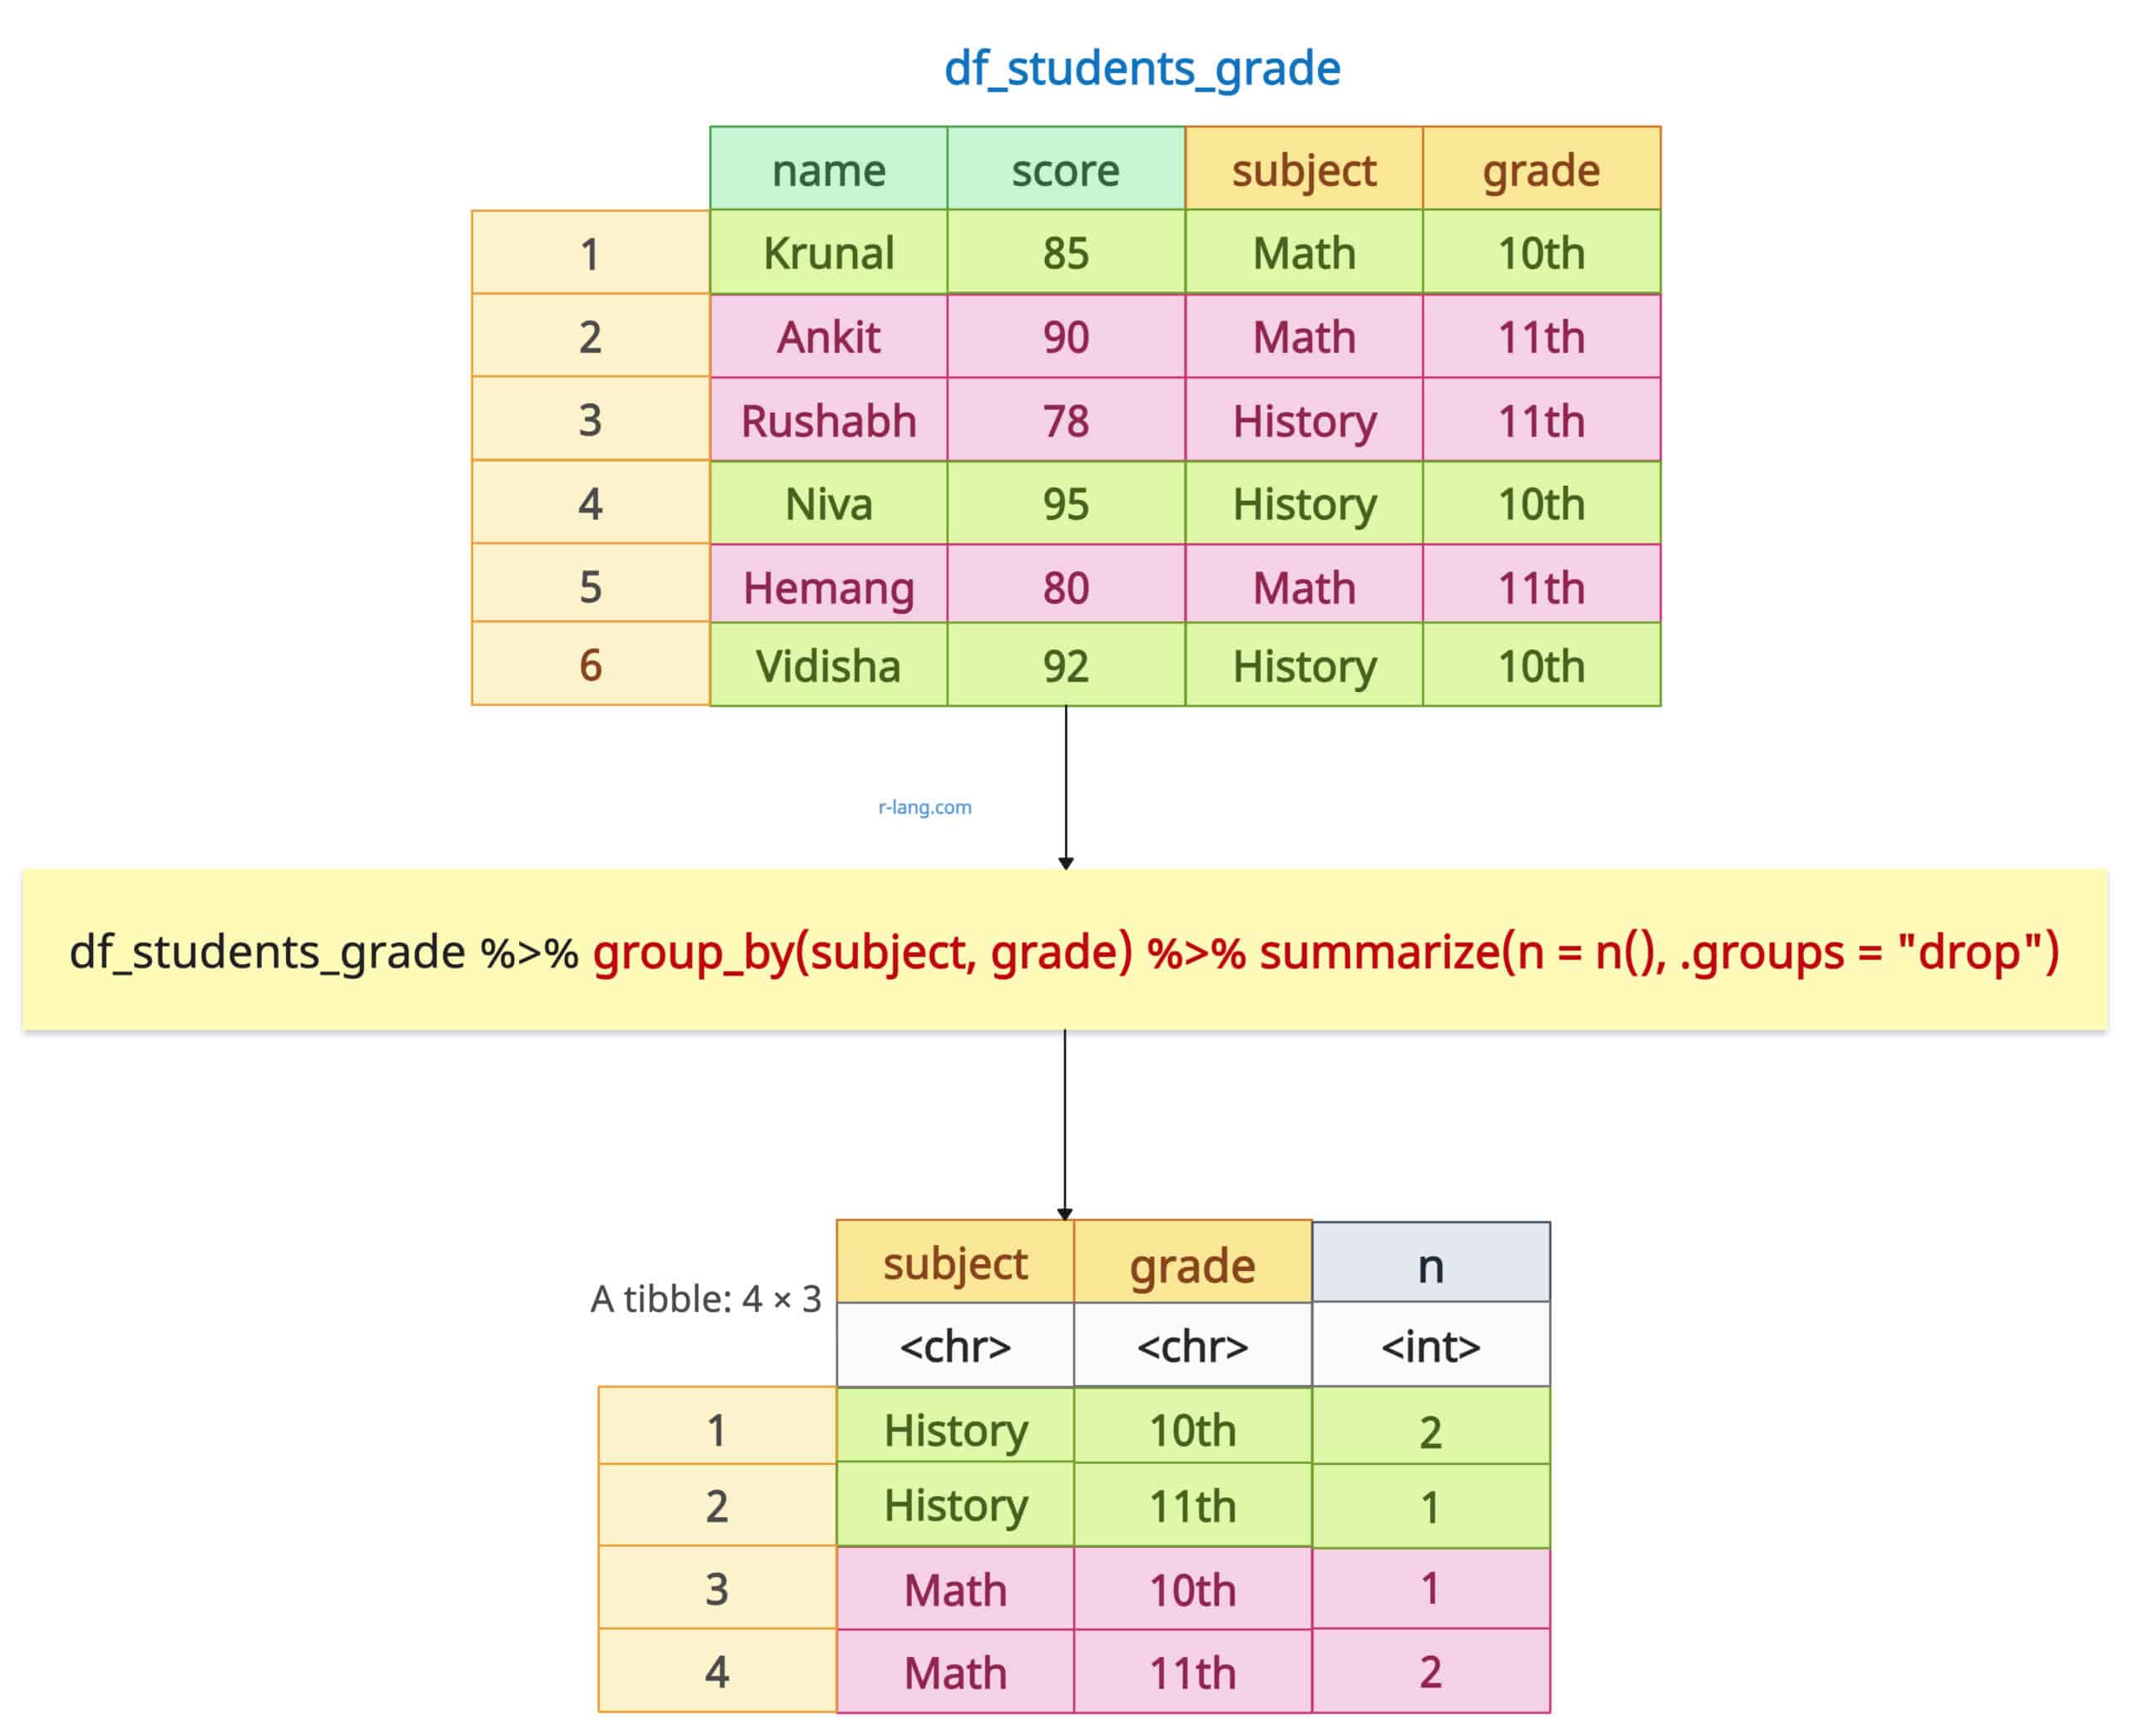
The above figure shows that the output is a 4×3 tibble representing counts for the combination of subject and grade variables.
It provides flexibility for adding multiple summary statistics alongside counts (e.g., mean, max). It also works seamlessly with other dplyr verbs in a pipeline.
However, you must explicitly ungroup() or manage grouping levels with the .groups argument.
That’s all!

Krunal Lathiya is a seasoned Computer Science expert with over eight years in the tech industry. He boasts deep knowledge in Data Science and Machine Learning. Versed in Python, JavaScript, PHP, R, and Golang. Skilled in frameworks like Angular and React and platforms such as Node.js. His expertise spans both front-end and back-end development. His proficiency in the Python language stands as a testament to his versatility and commitment to the craft.