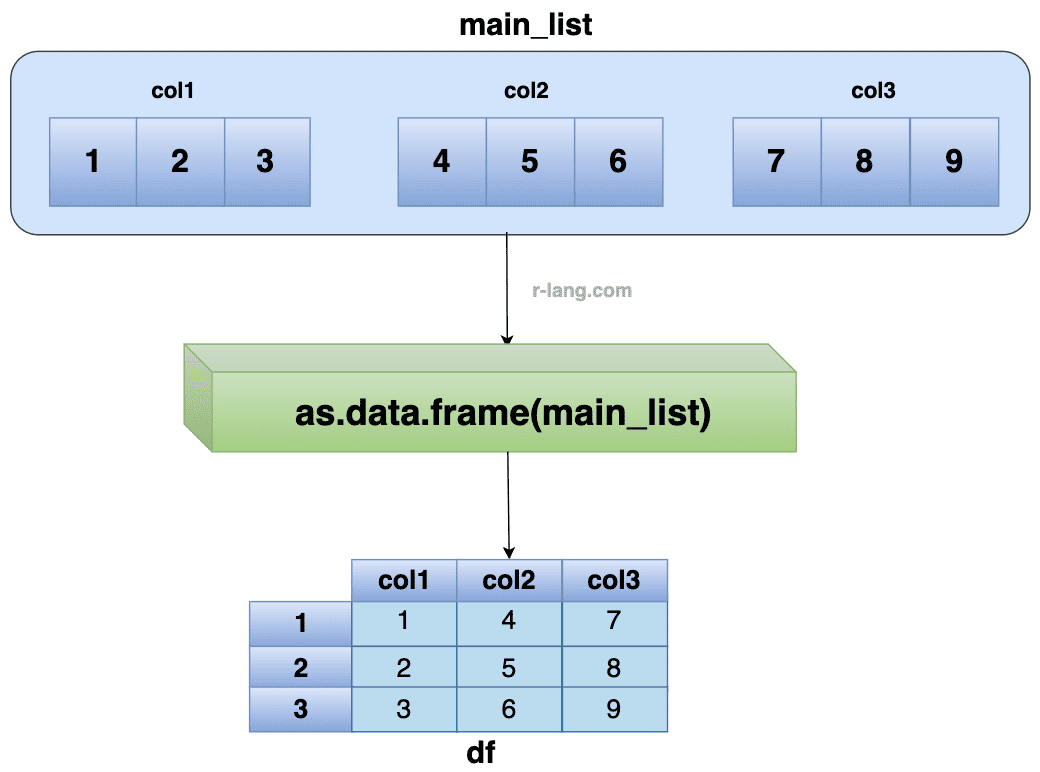
The fastest and easiest way to convert a list to a data frame in R is to use the “as.data.frame()” function. It checks whether an input object is a data frame and, if not, tries to convert it.
main_list <- list(
col1 = c(1, 2, 3),
col2 = c(4, 5, 6),
col3 = c(7, 8, 9)
)
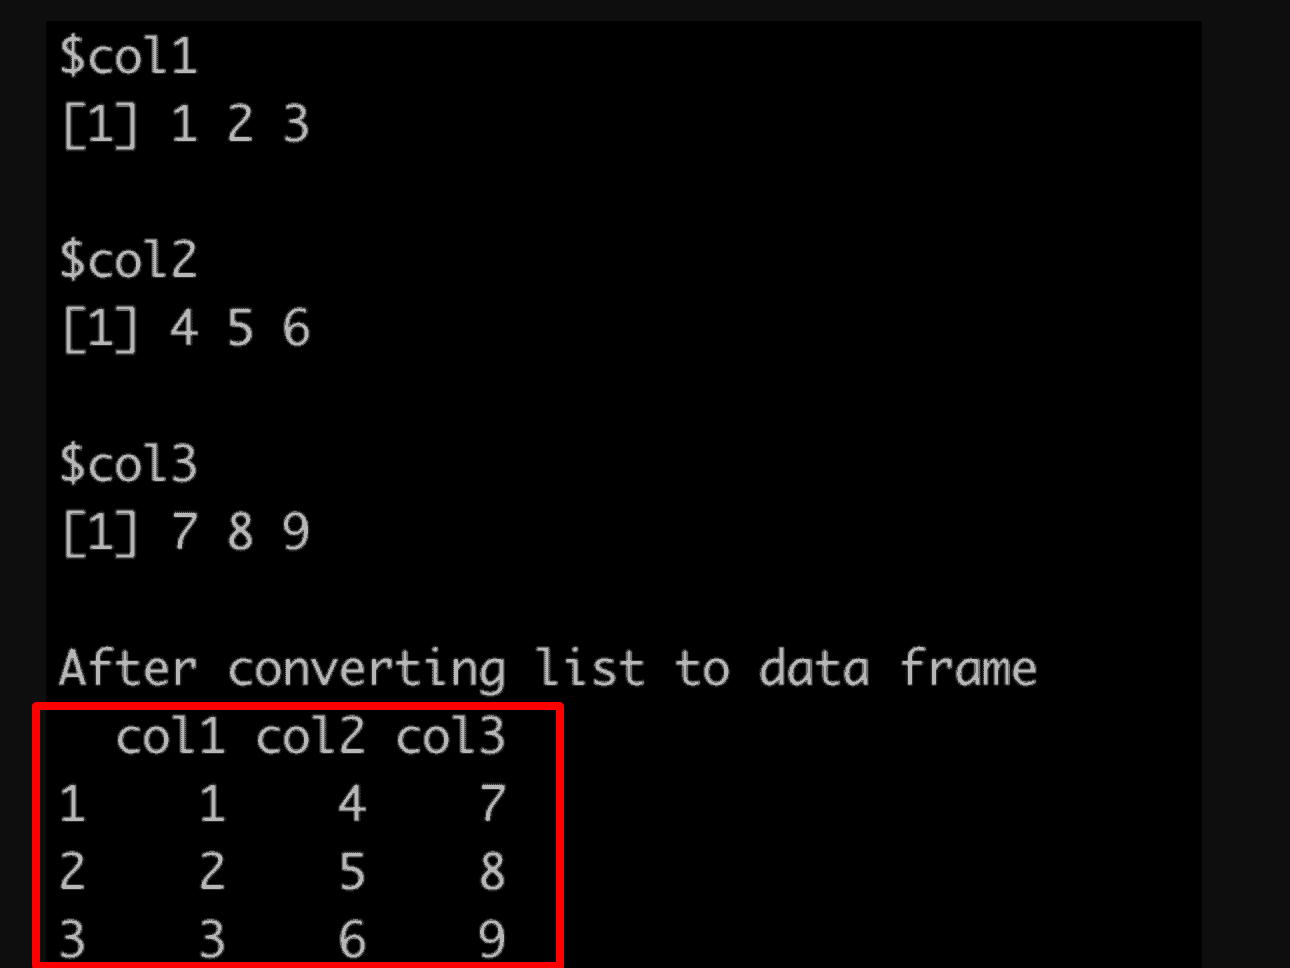
main_list
cat("After converting list to data frame", "\n")
as.data.frame(main_list)
Output
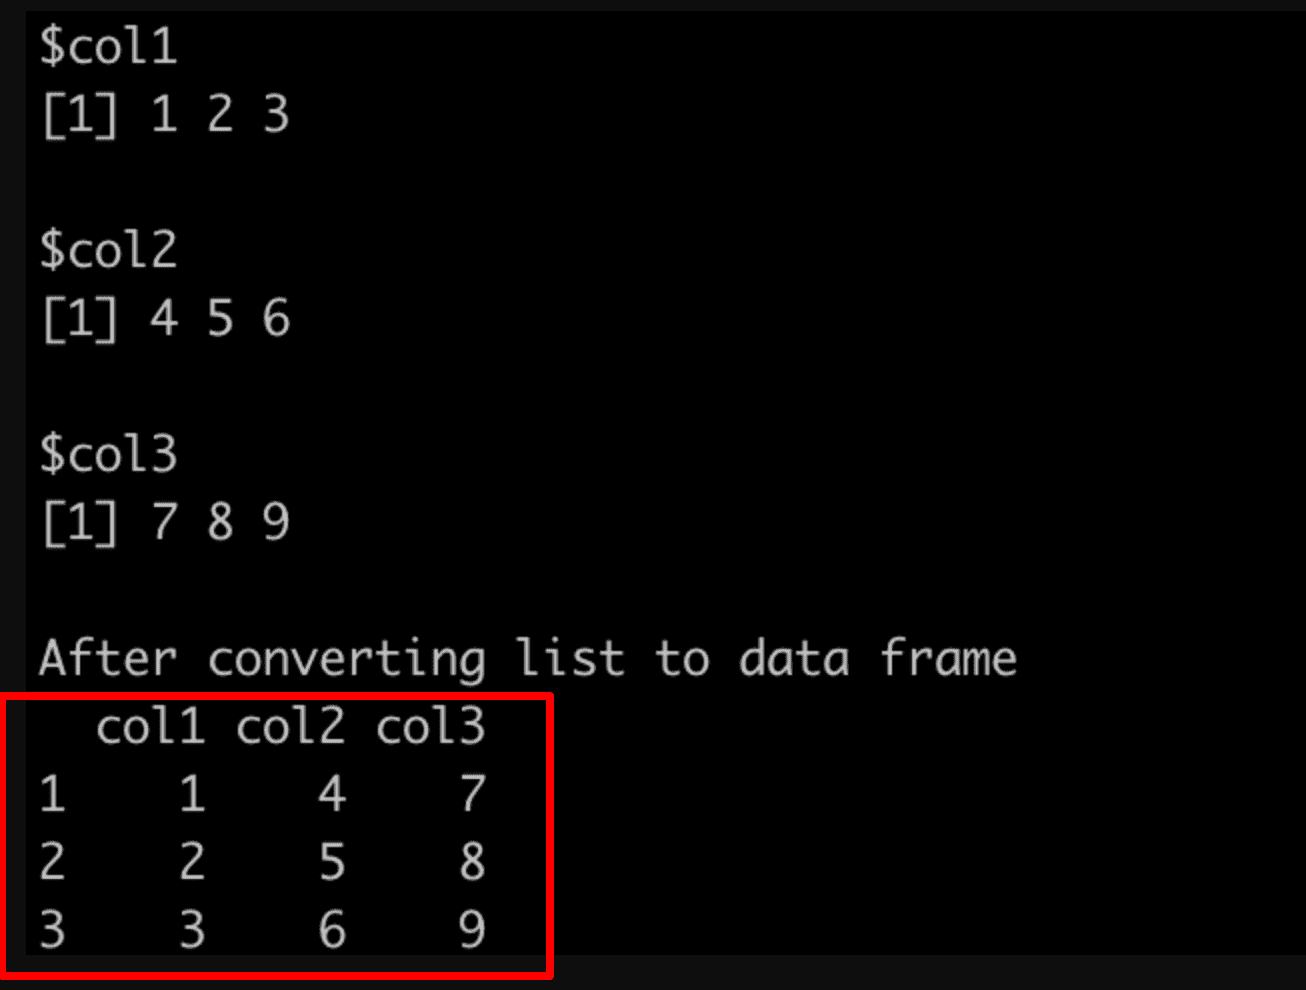
You can see from the above output that each list vector became a data frame column.
Nested lists
What if the input is a nested list? How would you deal with that? While as.data.frame() method is not ideal for converting nested lists into data frames, but you can use it with do.call() and rbind() for simpler nesting structures.
Using the do.call() and rbind() approach, we can iterate through the nested list, combine the inner lists into rows, and create a DataFrame.
nested_list <- list(
  list(1, "apple"),
  list(2, "banana")
)

df <- as.data.frame(do.call(rbind, nested_list))

print(df)
Output
   V1    V2
1  1    apple
2  2    banana
Here are four other ways:
- Using t() and do.call()
- Using do.call() with rbind() or cbind()
- Using data.table()
- Using as_tibble()
Alternate approach 1: Using the t() and do.call()
The t() function transposes a matrix or a data frame, but it can’t be directly used to convert a list to a data frame.
However, you can first convert the list to a matrix and then transpose it. It still depends on the structure of your list.
main_list <- list(
  col1 = c(1, 2, 3),
  col2 = c(4, 5, 6),
  col3 = c(7, 8, 9)
)

main_list

# convert the list to a matrix
mat <- do.call(rbind, main_list)

# transpose the matrix
mat <- t(mat)

# convert the matrix to a data frame
df <- as.data.frame(mat)

cat("After converting list to data frame", "\n")

print(df)
Output
Alternate Approach 2: Using do.call() with rbind()
The do.call(rbind, …) approach combines data frames vertically (by rows). This approach is helpful when you have a list of data frames and want to stack one on top of another to create a single, larger data structure.
# Example list of data frames
main_list <- list(
  df1 = data.frame(x = 1:3, y = 4:6),
  df2 = data.frame(x = 7:9, y = 10:12)
)

# Row-bind the data frames
df <- do.call(rbind, main_list)
df
Output
       x   y
df1.1  1   4
df1.2  2   5
df1.3  3   6
df2.1  7  10
df2.2  8  11
df2.3  9  12
Alternate approach 3: Using data.table()
Using the data. table () function, we can easily convert a nested list to a data table (an improved version of the data frame). The data table is different from the data frame and is more efficient.
If you have not installed the “data.table” library, then you need to install it first and then import it using the library() function like the code below:
library(data.table)

nested_list <- list(
  list(1, "apple"),
  list(2, "banana")
)
data_table <- data.table(do.call(rbind, nested_list))

print(data_table)
Output
     V1     V2
1:   1    apple
2:   2    banana
Alternate approach 4: Using tibble() and sapply()
The tibble is a modern take on the base data frame in R. Using tibble() and sapply() functions, we can convert a nested list into a tibble.
First, you need to install a “tibble” package in your R environment, and then you can import and use it.
library(tibble)

nested_list <- list(
  list(1, "apple"),
  list(2, "banana")
)

# Create a tibble with proper column names
tibble_df <- tibble(
  id = sapply(nested_list, `[[`, 1),
  fruit = sapply(nested_list, `[[`, 2)
)

print(tibble_df)
Output
 # A tibble: 2 × 2

  id      fruit
  <dbl>   <chr>
1  1      apple
2  2      banana
That’s all!

Krunal Lathiya is a seasoned Computer Science expert with over eight years in the tech industry. He boasts deep knowledge in Data Science and Machine Learning. Versed in Python, JavaScript, PHP, R, and Golang. Skilled in frameworks like Angular and React and platforms such as Node.js. His expertise spans both front-end and back-end development. His proficiency in the Python language stands as a testament to his versatility and commitment to the craft.