Here are the five ways to add single or multiple columns to a data frame in R:
Let’s understand how this works behind the scenes. In the Data Frame, each column represents a vector. To add a column, we just need to assign a new vector to a new column name. For multiple columns, we must assign multiple vectors to multiple new columns.
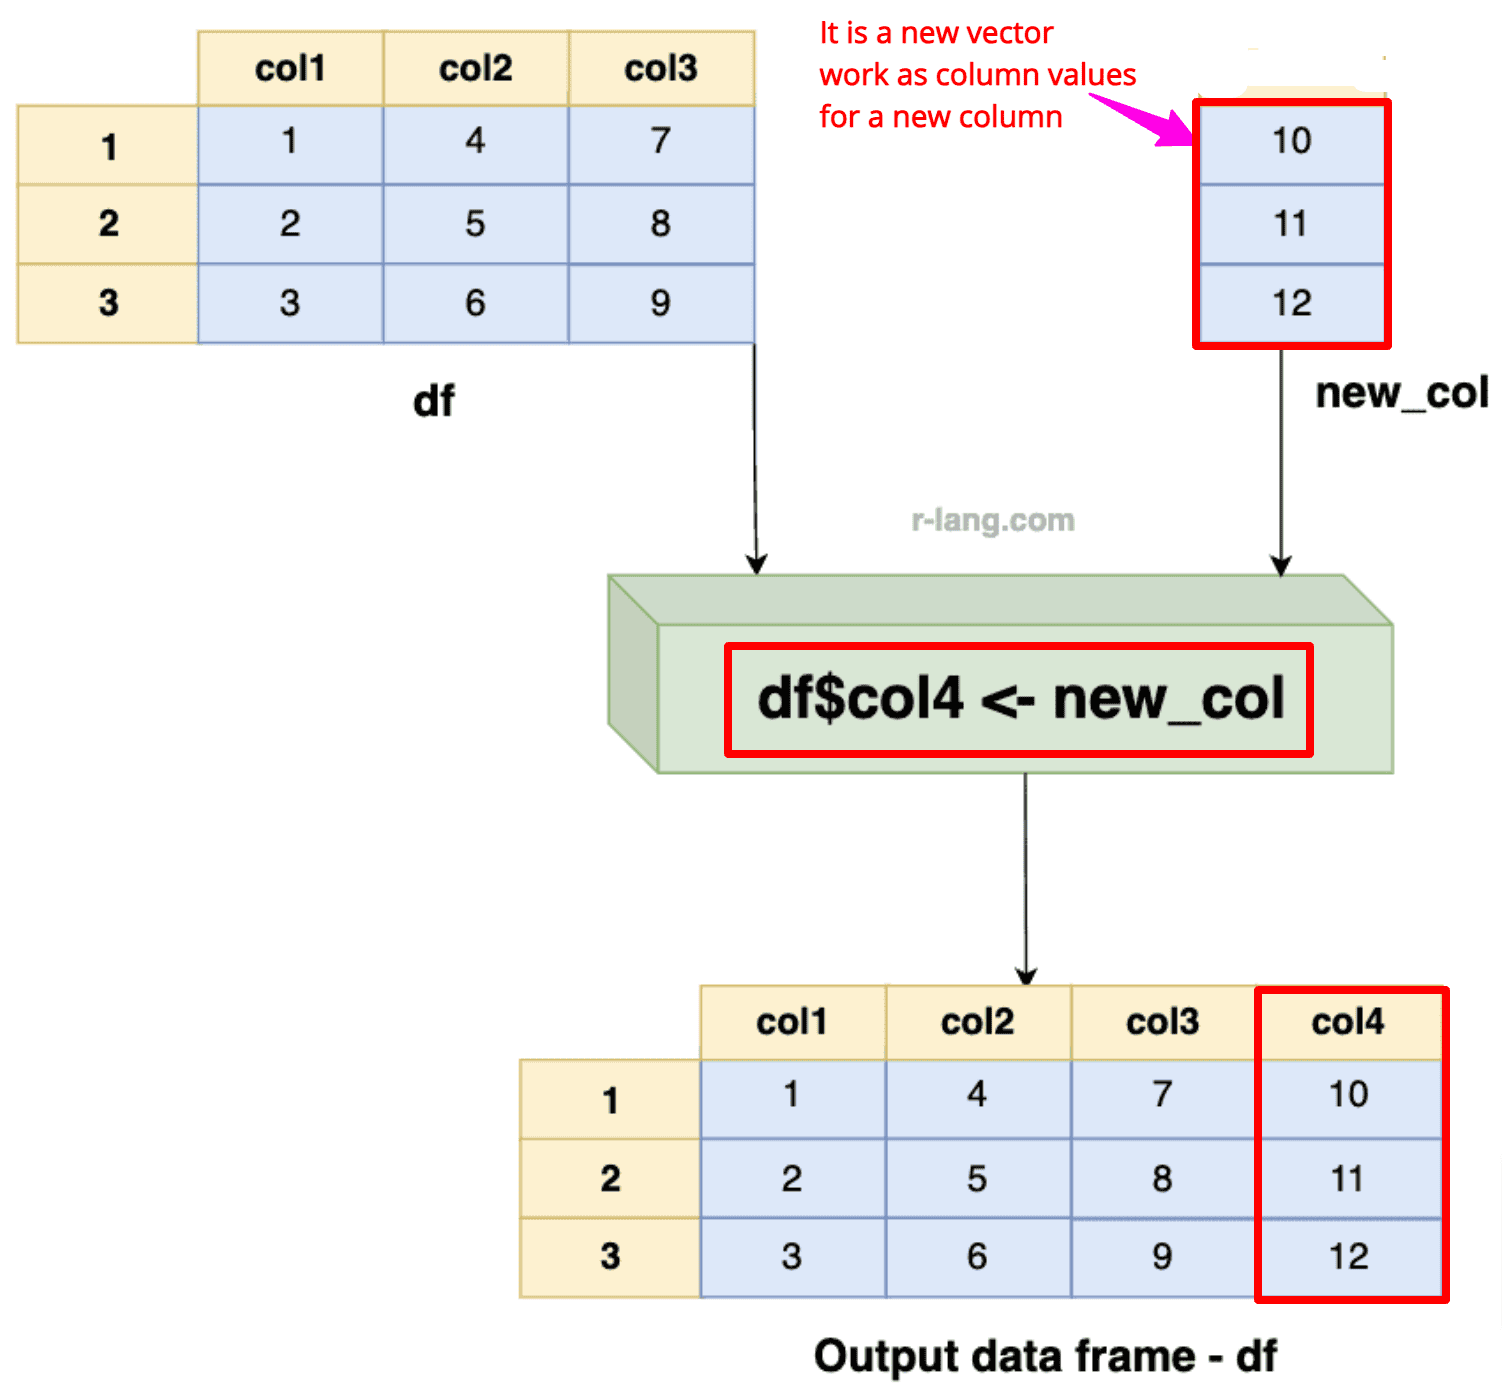
Define a new vector and assign values to that vector. This new vector will work as column values for a new column. Using the $ operator, create a new column name and assign the new vector as a value to that column.
It’s important that the length of the new vector is the same as the number of rows in the data frame.
This creates a new column in your existing data frame, and the values in the new vector are placed into this new column, row by row.
df$new_column <- vector
df <- data.frame(
  col1 = c(1, 2, 3),
  col2 = c(4, 5, 6),
  col3 = c(7, 8, 9)
)
df
new_col <- c(10, 11, 12)

df$col4 <- new_col
df
Output
The above figure shows that we added a new column, col4, with the values 10, 11, and 12 added to the data frame df.
Another way is to use square brackets. Like df[“new_col”] <- vector. Here, inside the square brackets, you need to define your new column name, which you want to add into a data frame df, and vector is the collection of column values.
Ensure new columns have the same number of rows as the data frame.
If your new column name is the same as the existing column name, it will be replaced with a new column name. So, verify your column names before executing the operation.
df[["new_column"]] <- vector

# Or

df["new_column"] <- vectordf <- data.frame(
col1 = c(1, 2, 3),
col2 = c(4, 5, 6),
col3 = c(7, 8, 9)
)
df
new_col <- c(10, 11, 12)
df["col4"] <- new_col
df
Output
The above figure illustrates that by specifying the name of the new column, “col4”, within the brackets on the left side of the assignment, new_col is assigned as the value for that column. The final data frame is a new column appended.
The basic function of cbind() is to combine data frames by columns. So, if I use the cbind() function with a data frame and another data frame or a vector, it will effectively add new columns to the original data frame.
We can add single or multiple columns to the data frame using the cbind() function.
df <- cbind(df, new_col1, new_col2)
df <- data.frame(
col1 = c(1, 2, 3),
col2 = c(4, 5, 6),
col3 = c(7, 8, 9)
)
df
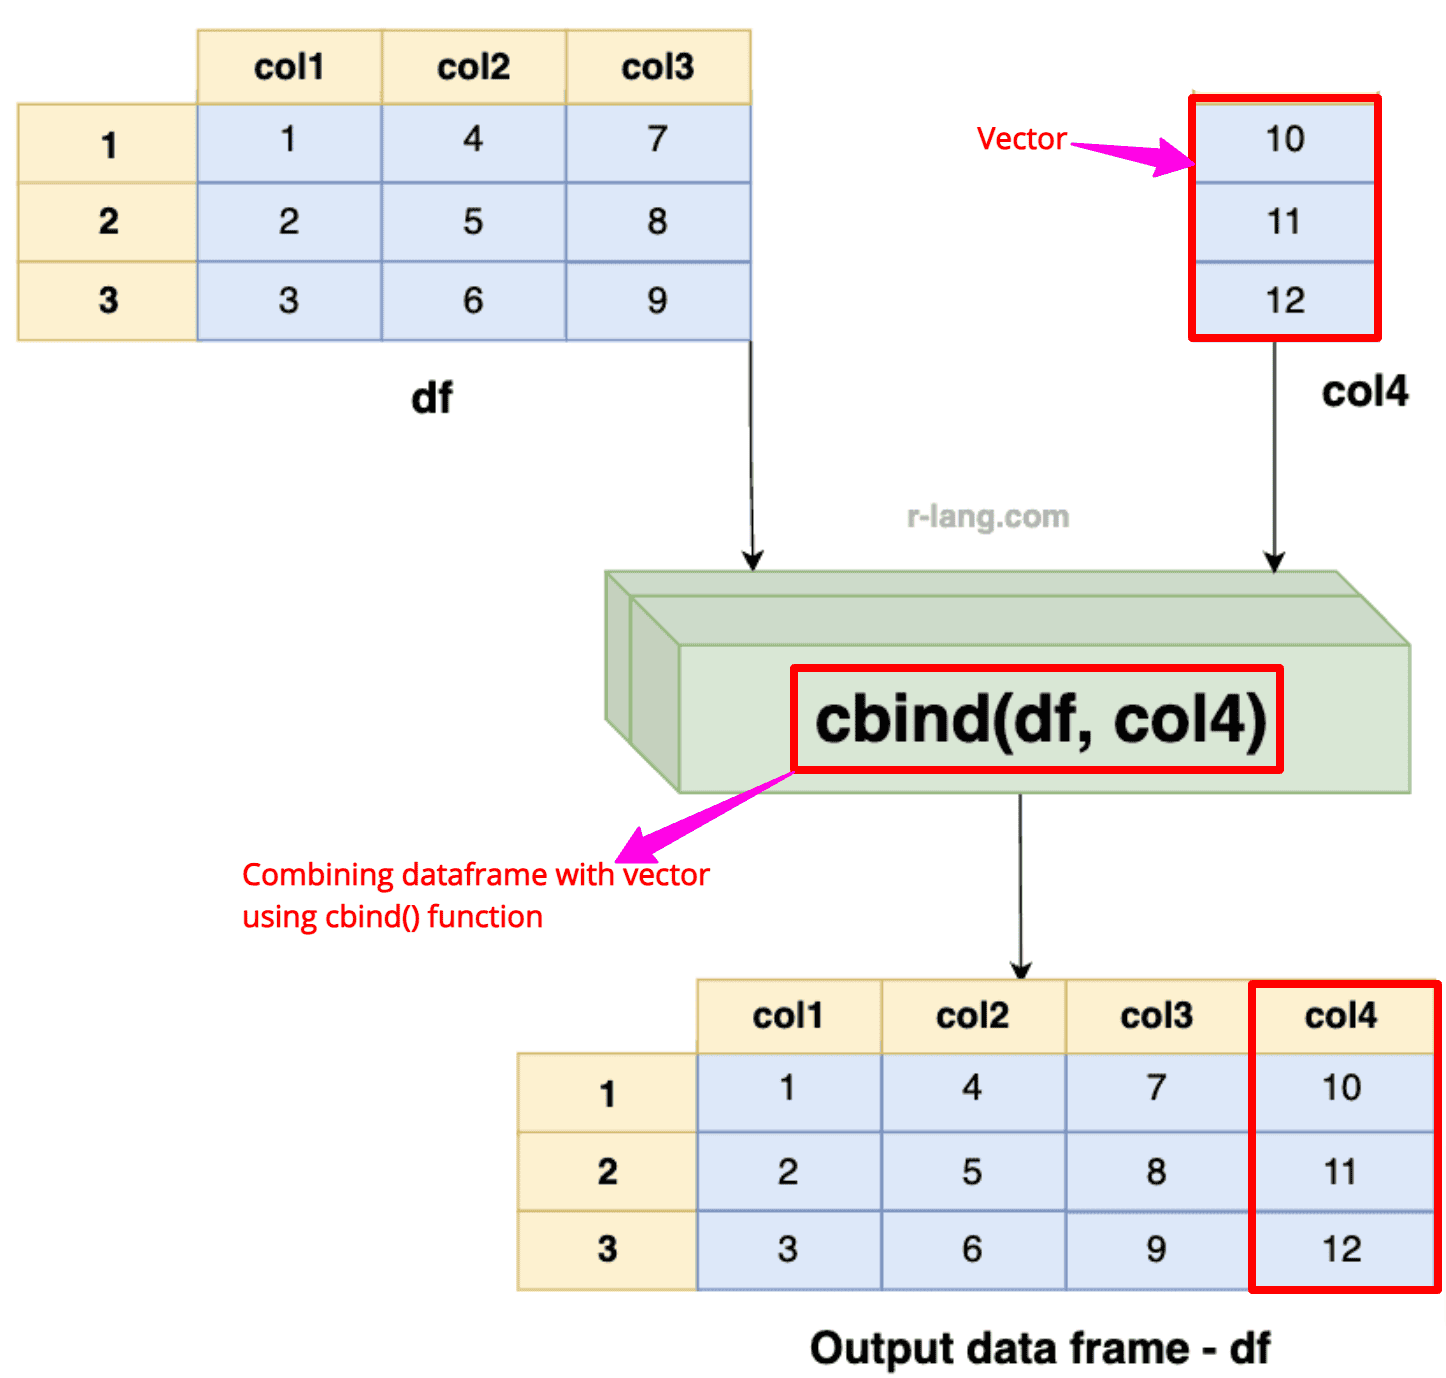
col4 <- c(10, 11, 12)
df <- cbind(df, col4)
df
Output
From the above output figure, we can see that we combined a data frame with a vector by columns using the cbind() function to append a single column (“col4”).
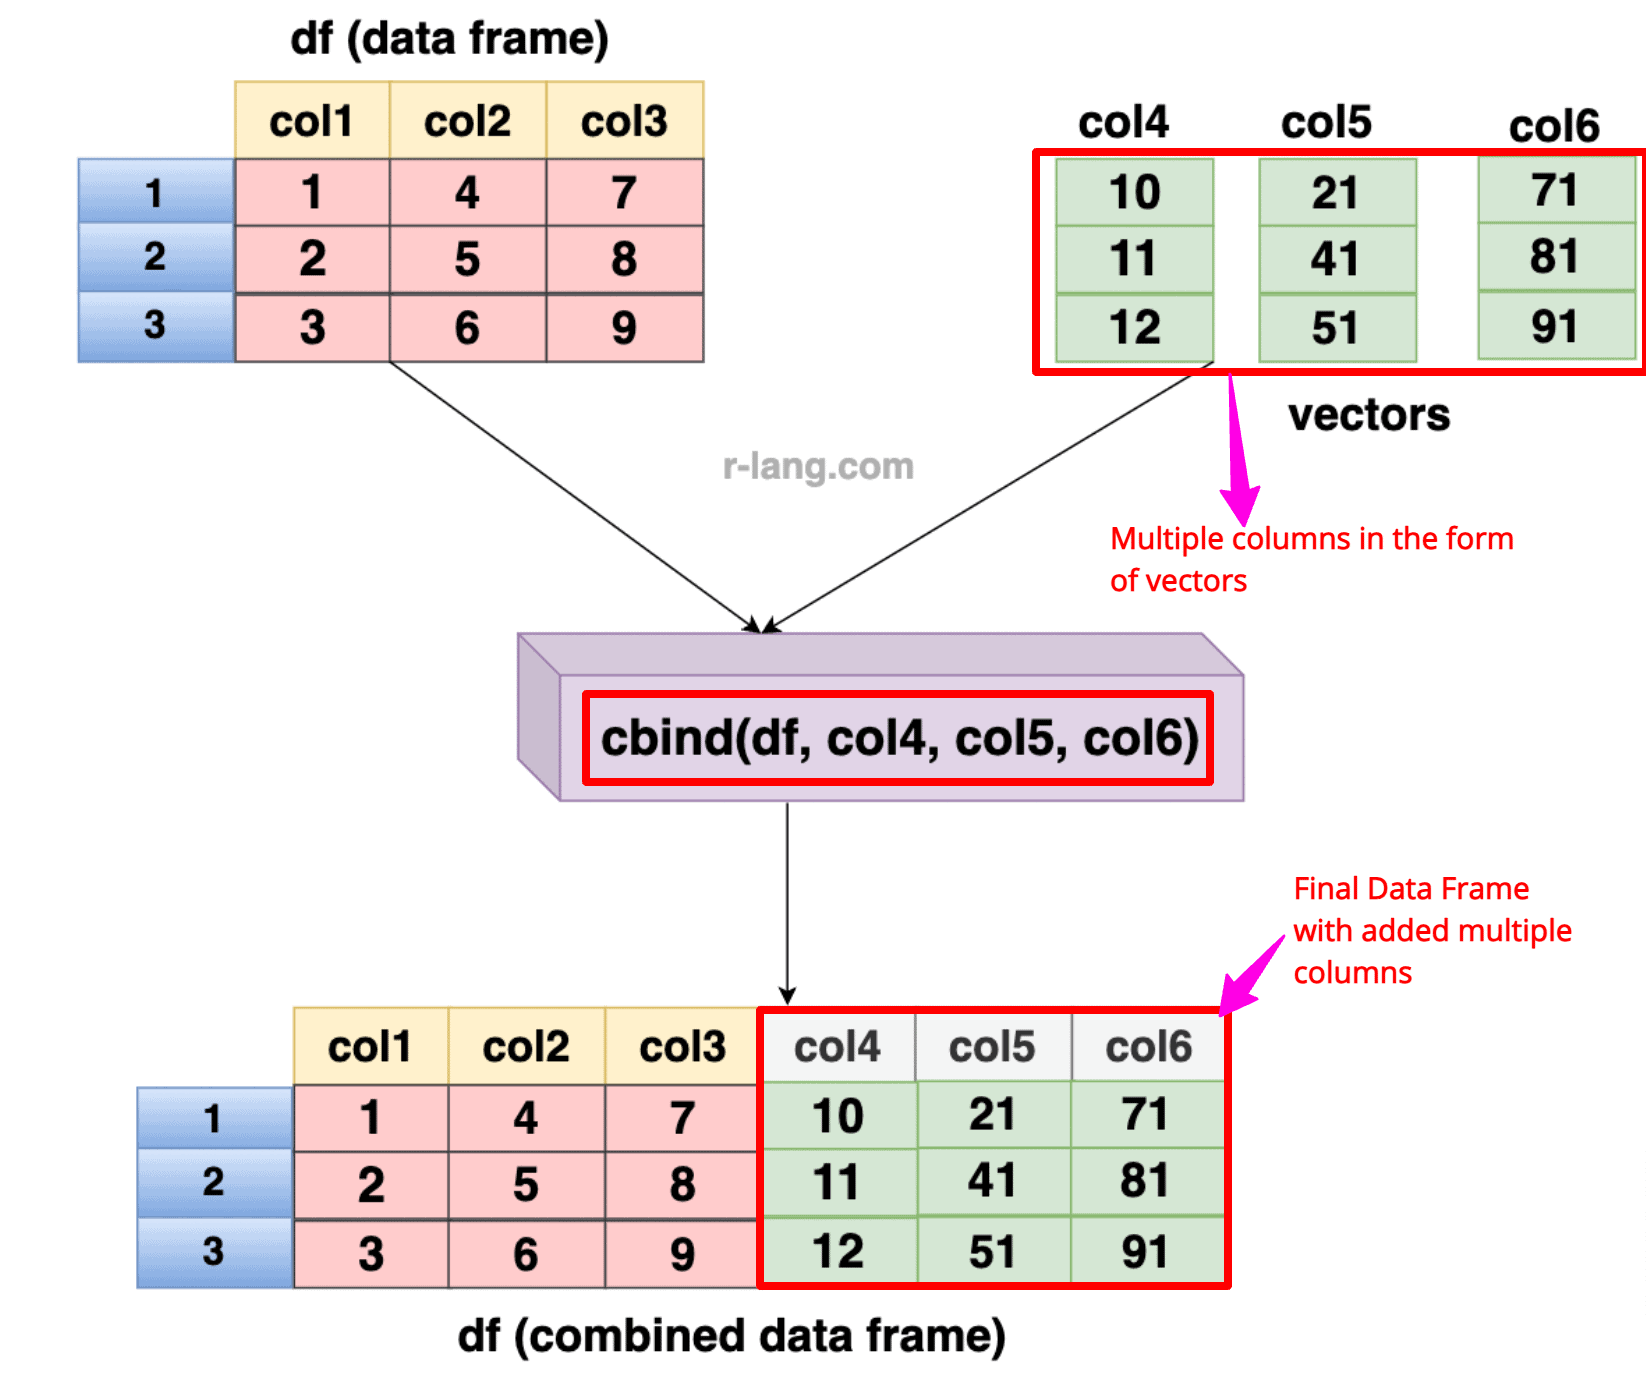
Let’s define three vectors (columns) that will be added to an existing data frame by columns using the cbind() function.
df <- data.frame(
  col1 = c(1, 2, 3),
  col2 = c(4, 5, 6),
  col3 = c(7, 8, 9)
)
df

col4 <- c(10, 11, 12)
col5 <- c(21, 41, 51)
col6 <- c(71, 81, 91)

df <- cbind(df, col4, col5, col6)
df
Output
In the above output figure, you can see that we added three additional columns, “col4”, “col5”, and “col6”, to the data frame.
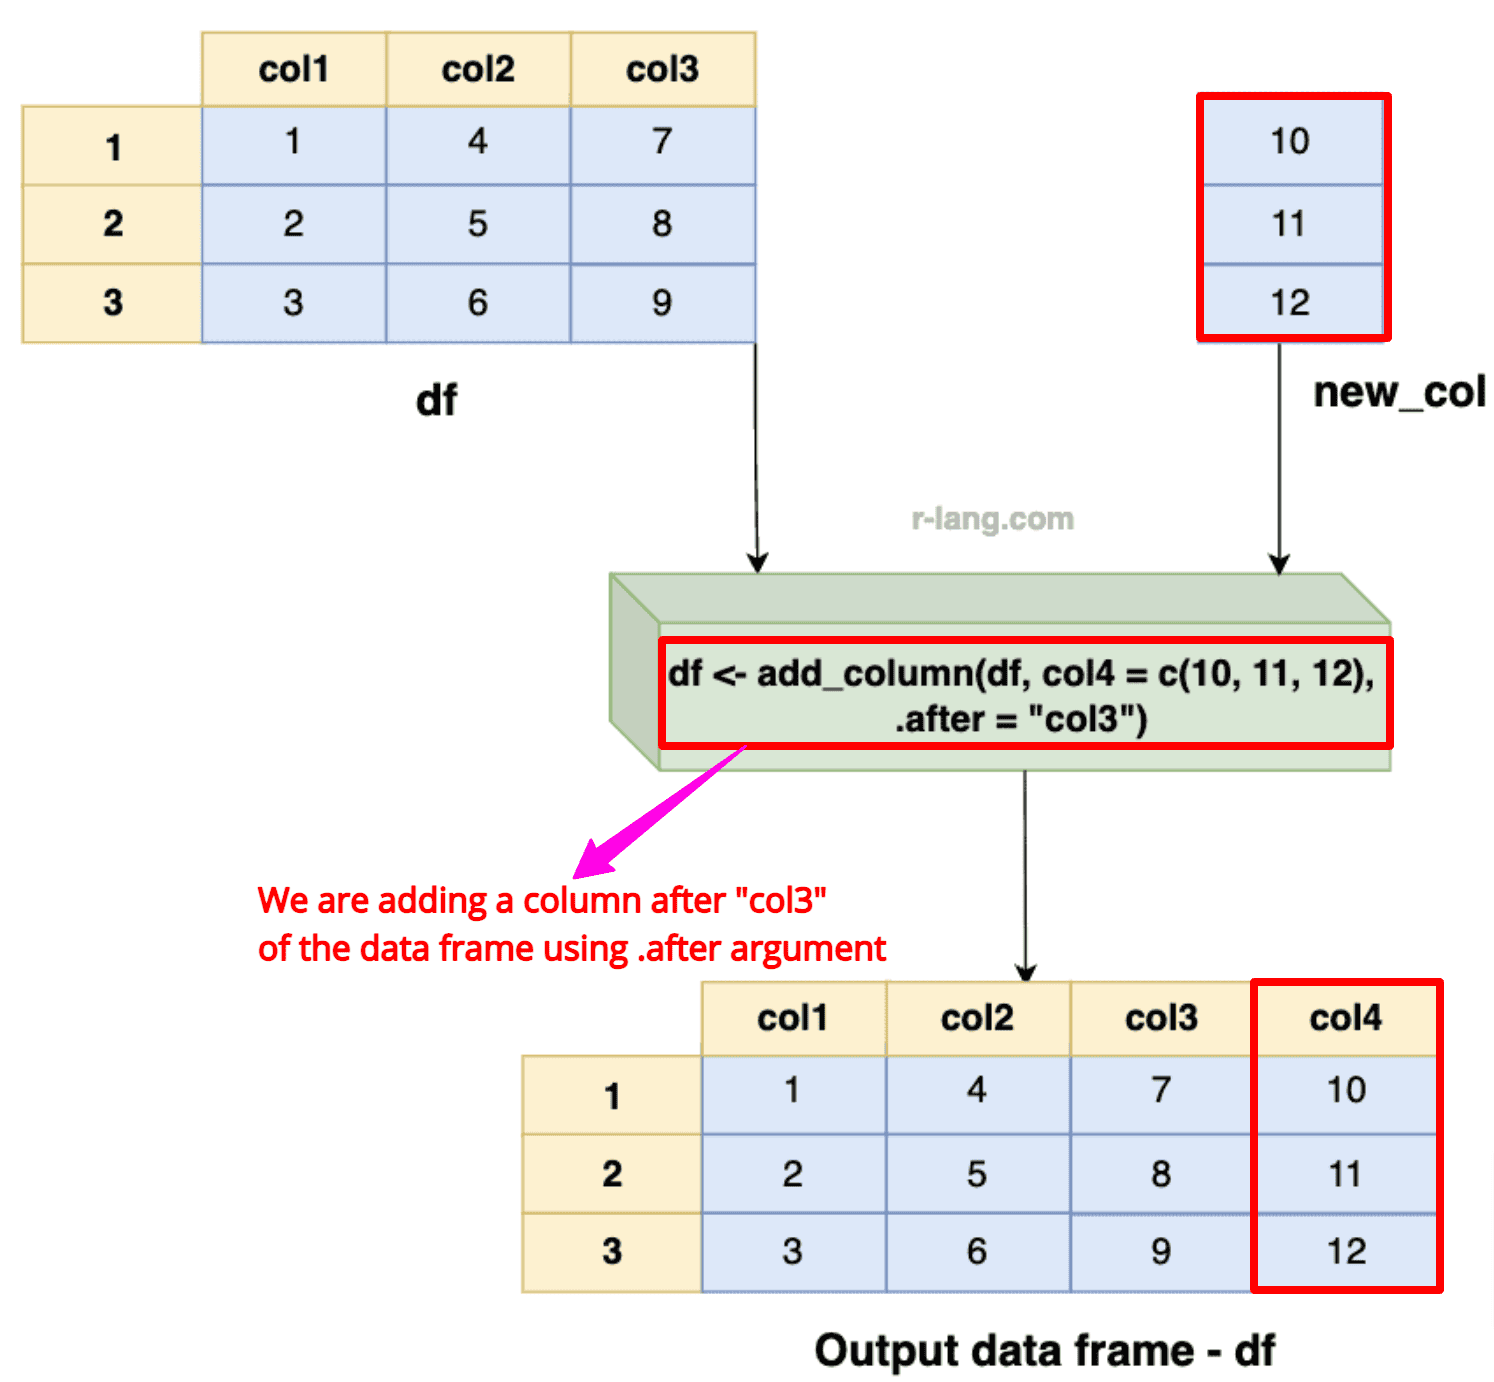
The tidyverse::add_column() function allows us to insert columns at specific positions of the data frame.
library(tidyverse)

df <- df %>% add_column(new_col = vector, .before = 1, .after = 2, .name_repair = "check_unique")
library(tidyverse)

df <- data.frame(
  col1 = c(1, 2, 3),
  col2 = c(4, 5, 6),
  col3 = c(7, 8, 9)
)
df

col4 <- c(10, 11, 12)

df <- add_column(df, col4 = c(10, 11, 12), .after = "col3")
df
Output
The above visual represents that we have added “col4” after “col3” of the data frame by specifying the .after argument.
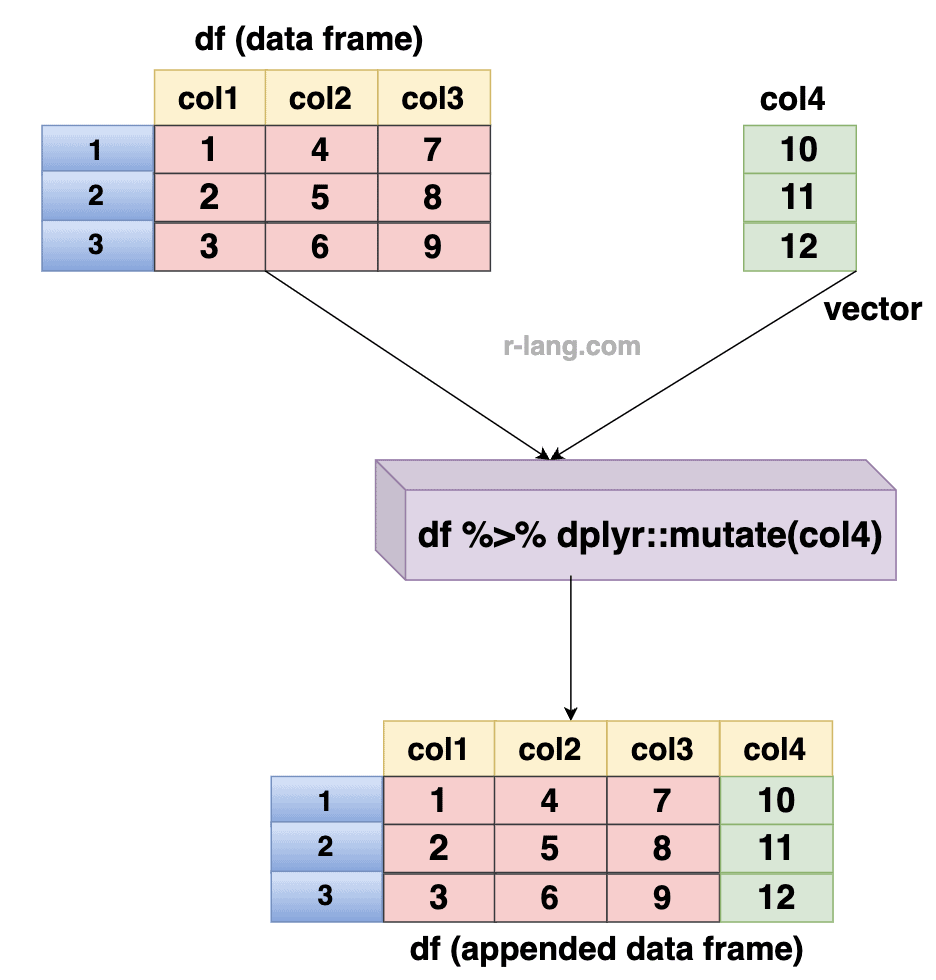
The dplyr::mutate() method allows us to append single or multiple columns at once while preserving existing ones.
So if I load dplyr, I can do df %>% mutate(new_col1 = vec1, new_col2 = vec2). That would add both columns simultaneously.
library(dplyr)

df <- df %>% mutate(new_col1 = vec1, new_col2 = vec2)
library(dplyr)

df <- data.frame(
  col1 = c(1, 2, 3),
  col2 = c(4, 5, 6),
  col3 = c(7, 8, 9)
)
df

col4 <- c(10, 11, 12)

df <- df %>% mutate(col4)
df
Output
As shown in the above picture, we modified an existing data frame by adding “col4” using the dplyr::mutate() method.
That’s it!
Krunal Lathiya is a seasoned Computer Science expert with over eight years in the tech industry. He boasts deep knowledge in Data Science and Machine Learning. Versed in Python, JavaScript, PHP, R, and Golang. Skilled in frameworks like Angular and React and platforms such as Node.js. His expertise spans both front-end and back-end development. His proficiency in the Python language stands as a testament to his versatility and commitment to the craft.
The scale() function in R centers (subtracting the mean) and/or scales (dividing by the standard…
To rename a file in R, you can use the file.rename() function. It renames a…
The prop.table() function in R calculates the proportion or relative frequency of values in a…
The exp() is a built-in function that calculates the exponential of its input, raising Euler's…
The split() function divides the input data into groups based on some criteria, typically specified…
The colMeans() function in R calculates the arithmetic mean of columns in a numeric matrix,…